Figure 3.
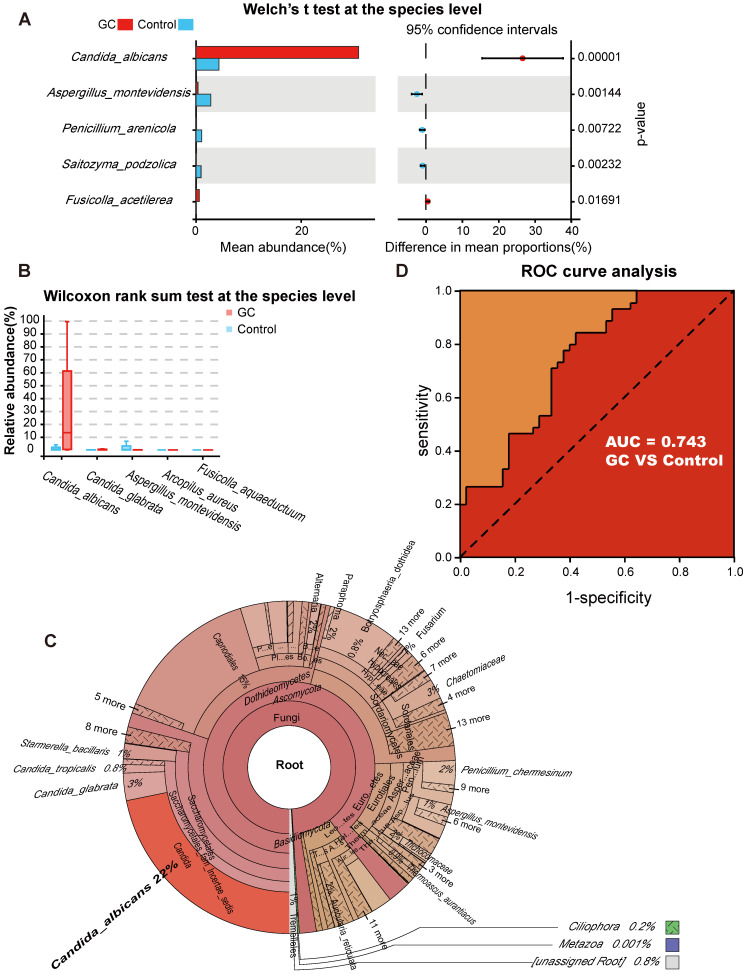
Candida albicans as an indicator fungus for GC. Differences in fungal species abundance between the GC (n=45) and control (n=45) groups were detected using Welch's t test (A) or Wilcoxon rank sum test (B), and Candida albicans was significantly elevated in the GC group (p<0.0001). (C) Species annotation was performed based on the sequence information of the OTUs, a Krona pie chart was established at the species level, and the absolute abundance of C. albicans accounted for 22%. (D) The markers achieved an area under the receiver operating characteristic curve (AUC) of 0.743 for the classification of the GC group from the control group.

