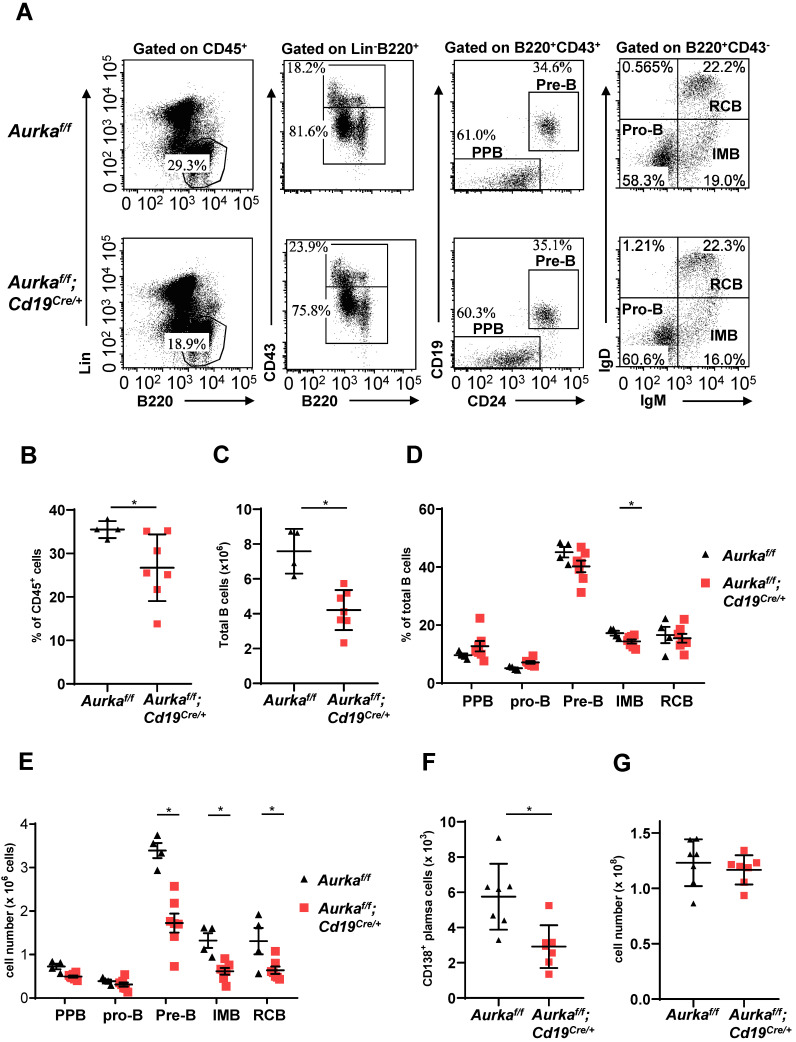
Figure 2.
B cell development was impaired in BM. (A) The distribution of various B-cell populations in the BM of mice with different genotypes was assessed by flow cytometry. The data shown are representative of one of three independent experiments. (B) The dot graph shows the percentage of Lin-B220+ B cells gated on CD45+ cells in the BM. *, P < 0.05. (C) The dot graph shows the total number of Lin-B220+ B cells in the BM. *, P < 0.05. (D) The dot graph shows the percentage of various B-cell populations in the BM of mice with different genotypes. *, P < 0.05. (E) Dot graph shows the total number of various B-cell populations in the BM of mice with different genotypes. The total number of indicated cells was calculated following the following formula: the number of indicated B cells/the number of gated single cells × the total nucleated cells recovered from BM. *, P < 0.05. (F) CD19+ B cells (1 × 10⁵) in the BM of mice with different genotypes were analyzed. The dot graph shows the number of CD138+ plasma cells in these CD19+ B cells. *, P < 0.05. (G) The dot graph shows the total number of nucleated cells in the BM of mice with different genotypes. *, P < 0.05. (B-G) Data shown are mean ± SD of one of three independent experiments (n = 4 - 7 mice/group) with similar results. Significance was calculated using an unpaired Student's t-test.

