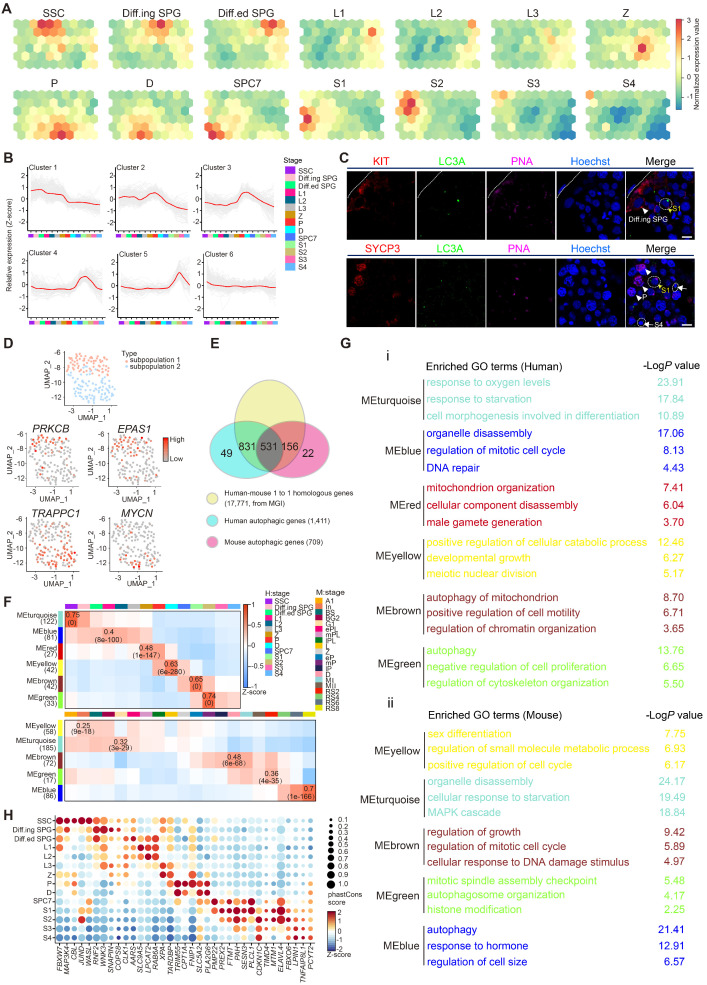
Figure 1.
Global transcriptional signatures of autophagic genes in human spermatogenesis. (A) Temporal expression of autophagic genes represented by the SOM algorithm; a distinct set of autophagy-related genes are enriched in each cell cluster. A gradient of green to red indicates low to high normalized expression values. Spermatogonial stem cell (SSC), differentiating spermatogonia (Diff.ing SPG), differentiated spermatogonia (Diff.ed SPG), leptotene 1 (L1), leptotene 2 (L2), leptotene 3 (L3), zygotene (Z), pachytene (P), diplotene (D), spermatocyte 7 (SPC7), spermatid 1 (S1), spermatid 2 (S2), spermatid 3 (S3), spermatid 4 (S4). (B) K-means clustering of differentially expressed autophagic genes throughout human spermatogenesis into six individual clusters. (C) Immunofluorescence of KIT (red, top) and SYCP3 (red, bottom) co-stained with LC3A (green) and PNA (pink) in adult human testicular paraffin sections from one OA donor as a control. Differentiating spermatogonia (Diff.ing SPG), pachytene (P), spermatid 1 (S1), spermatid 4 (S4). The scale bars represent 10 μm. (D) UMAP showing two subpopulations of human SSCs (top). Gene expression patterns of specific autophagic genes on UMAP plots. PRKCB and EPAS1 were enriched in subpopulation 1, and TRAPPC1 and MYCN were enriched in subpopulation 2 (middle and bottom, respectively). A gradient of gray to red indicates low to high expression levels. (E) Venn diagram showing the distribution and relationship between human-mouse homologous genes (17,771) and human (1,411)- and mouse (709)- autophagic genes. (F) WGCNA map showing modules derived from 531 homologous autophagic genes enriched in each human (top)- and mouse (bottom)- spermatogenic cell cluster. Pearson correlation coefficients (top) and P values (bottom) to calculate the correlations between gene modules and cell clusters were highlighted in some cells. (G) Enriched GO terms and P values of modules in Figure 1F are indicated by distinct colors. (H) Bubble plot showing the top five autophagic genes derived from 37 DEGs of 14 human spermatogenic cell clusters in Figure S1G. The size of each circle represents each gene's phastCons score. A gradient of blue to red indicates low to high expression levels.

