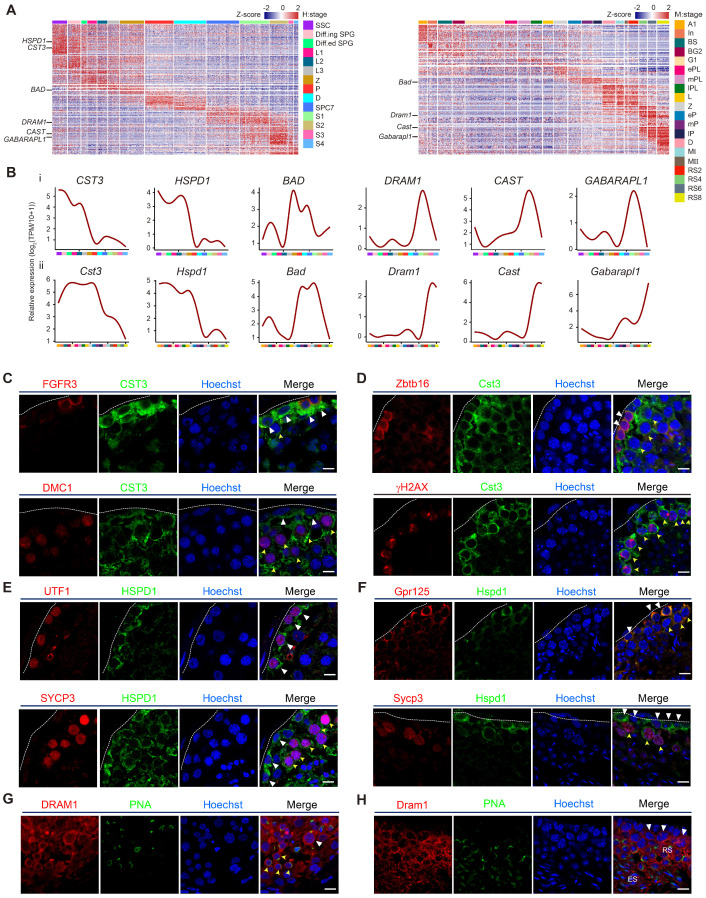
Figure 3.
Validation of autophagic gene expression in human and mouse spermatogenesis. (A) Heatmap of differentially expressed autophagic genes in adult human (left) and mouse (right) spermatogenic cells. The color key from blue to red indicates low to high gene expression levels. (B) Line chart showing the relative expression patterns of novel autophagic genes in each human- and mouse-spermatogenic cell cluster (i: human, ii: mouse). (C) Immunofluorescence of FGFR3 (red, top) and DMC1 (red, bottom) co-stained with CST3 (green) in adult human testicular paraffin sections from one donor with OA. Triangles indicate SSCs, yellow arrowheads indicate spermatocytes. The scale bars represent 10 μm. (D) Immunofluorescence of Zbtb16 (red, top) and γH2AX (red, bottom) co-stained with Cst3 (green) in adult mouse testicular paraffin sections from 8-week-old mice. Triangles indicate spermatogonia, and yellow arrowheads indicate spermatocytes. The scale bars represent 10 μm. (E) Immunofluorescence of UTF1 (red, top) and SYCP3 (red, bottom) co-stained with HSPD1 (green) in adult human testicular paraffin sections from one donor with OA. Triangles indicate SSCs, yellow arrowheads indicate spermatocytes. The scale bars represent 10 μm. (F) Immunofluorescence of Gpr125 (red, top) and Sycp3 (red, bottom) co-stained with Hspd1 (green) in adult mouse testicular paraffin sections from 8-week-old mice. Triangles indicate spermatogonia, yellow arrowheads indicate spermatocytes. The scale bars represent 10 μm. (G) Immunofluorescence of DRAM1 (red) co-stained with PNA (green) in adult human testicular paraffin sections from one donor with OA. Triangle indicates spermatocyte, and yellow arrowheads indicate round spermatids. The scale bar represents 10 μm. (H) Immunofluorescence of Dram1 (red) co-stained with PNA (green) in adult mouse testicular paraffin sections from 8-week-old mice. Triangles indicate spermatocytes; RS, round spermatids; ES, elongated spermatids. The scale bar represents 10 μm.

