Figure 2.
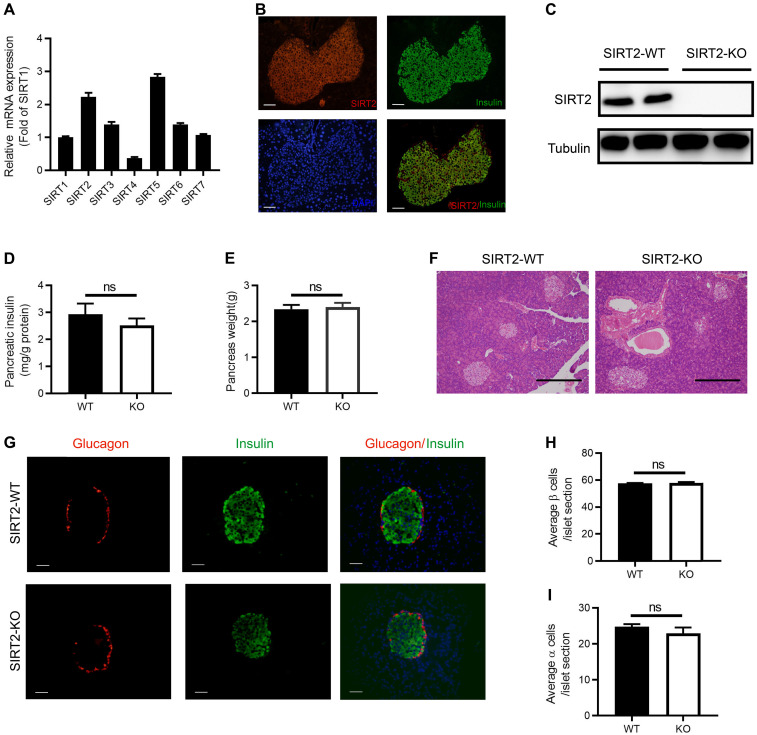
Morphology of islet and pancreatic insulin content in SIRT2-KO rats. (A) The mRNA expression of sirtuin family in normal islets (n=3). (B) Representative examples of normal islets stained by immunofluorescence for SIRT2 (red), insulin (green), and nuclei (DAPI, blue) (bar=40 μm). (C) Immunoblotting of SIRT2 in islets isolated from SIRT2-WT and SIRT2-KO rats. (D) Total pancreatic insulin content normalized to total protein (n=4-5). (E) Pancreatic weight of SIRT2-WT and SIRT2-KO rats (n=4-5). (F) Histological analysis of pancreas isolated from SIRT2-WT and SIRT2-KO rats. Hematoxylin-eosin staining samples were photographed at 200 magnification (bar=0.5 mm). (G) Representative islet of SIRT2-WT and SIRT2-KO rats stained by immunofluorescence for insulin (green), glucagon (red), and nuclei (DAPI, blue) (bar=40 μm). (H-I) Average number of β cells and α cells per islet section (n=3). Data are expressed as means ± SEM.

