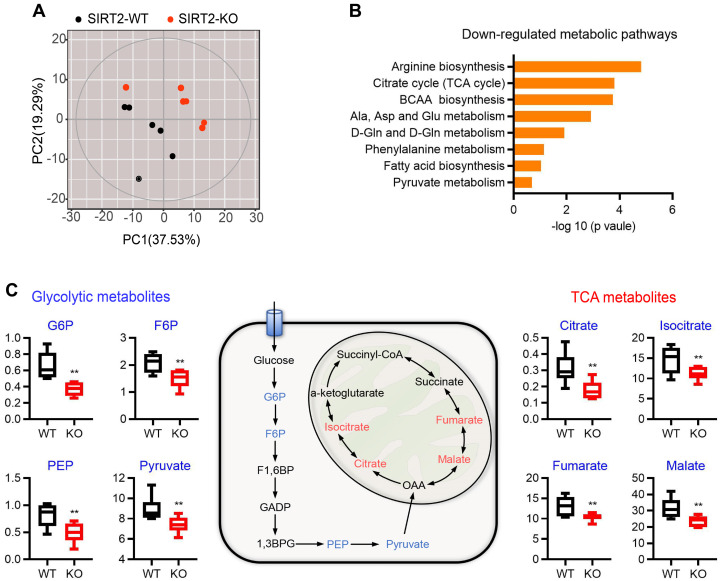
Figure 4.
Metabolomic change of islets isolated from SIRT2-KO rats. (A) Overview of metabolic profiles. Metabolomics data were obtained from islet extracts (n=6). (B) Main down-regulated metabolic pathways obtained from differential metabolites of SIRT2-KO islets compared with SIRT2-WT islets. (C) Schematic representation of intermediates in glycolysis and TCA cycle. The relative levels of indicated metabolites are shown on both sides. Data are expressed as means ± SEM. *P< 0.05, **P< 0.01 vs WT rats.

