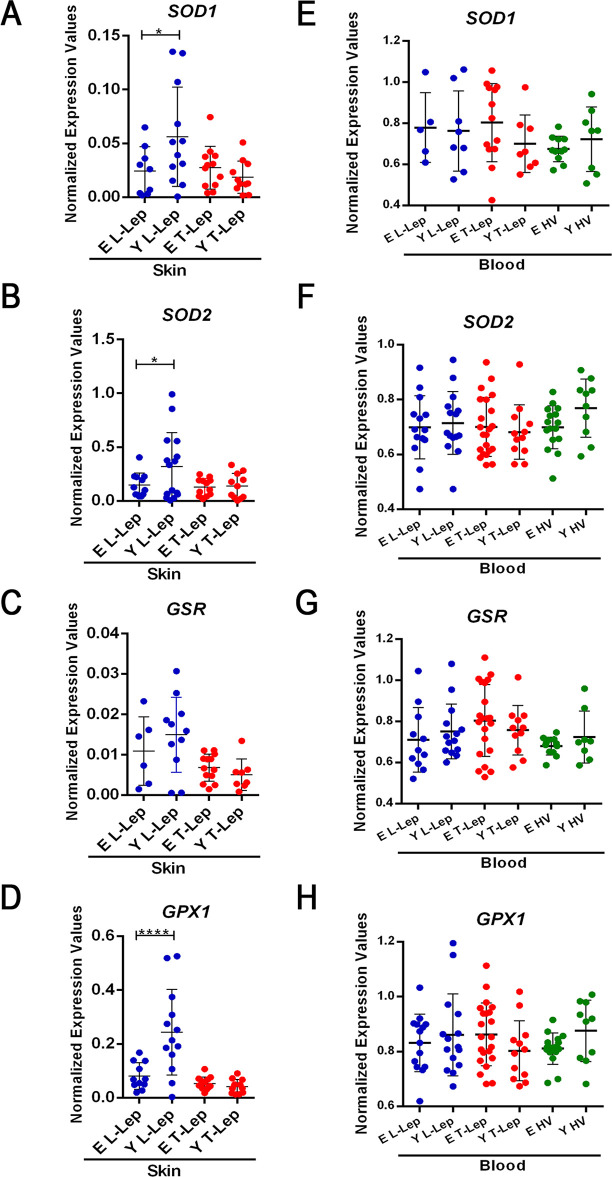
Fig 4. Gene expression analysis of antioxidant enzymes in whole blood and skin lesions.
Quantitative PCR (qPCR) evaluation of mRNA levels of SOD1 (A and E), SOD2 (B and F), GSR (C and G) and GPX1 (D and H) was performed in whole blood and skin lesion samples. Each circle represents one individual. Horizontal bars represent the mean values ± SD. Data analysis was performed using ordinary one-way ANOVA followed by Holm-Sidak’s multiple comparison test (A, B, and G). Kruskal-Wallis test followed by Dunn’s multiple comparison post-test was used for the analysis of non-normally distributed and/or heteroscedastic data (C). Variation in number of individuals for each gene expression analysis was due to lack of amplification. **P < 0.01, ***P < 0.001 and ***P = 0.0001. Abbreviations: E–Elderly; Y–Young; T-Lep–TT/BT patients; L-Lep–BL/LL patients.

