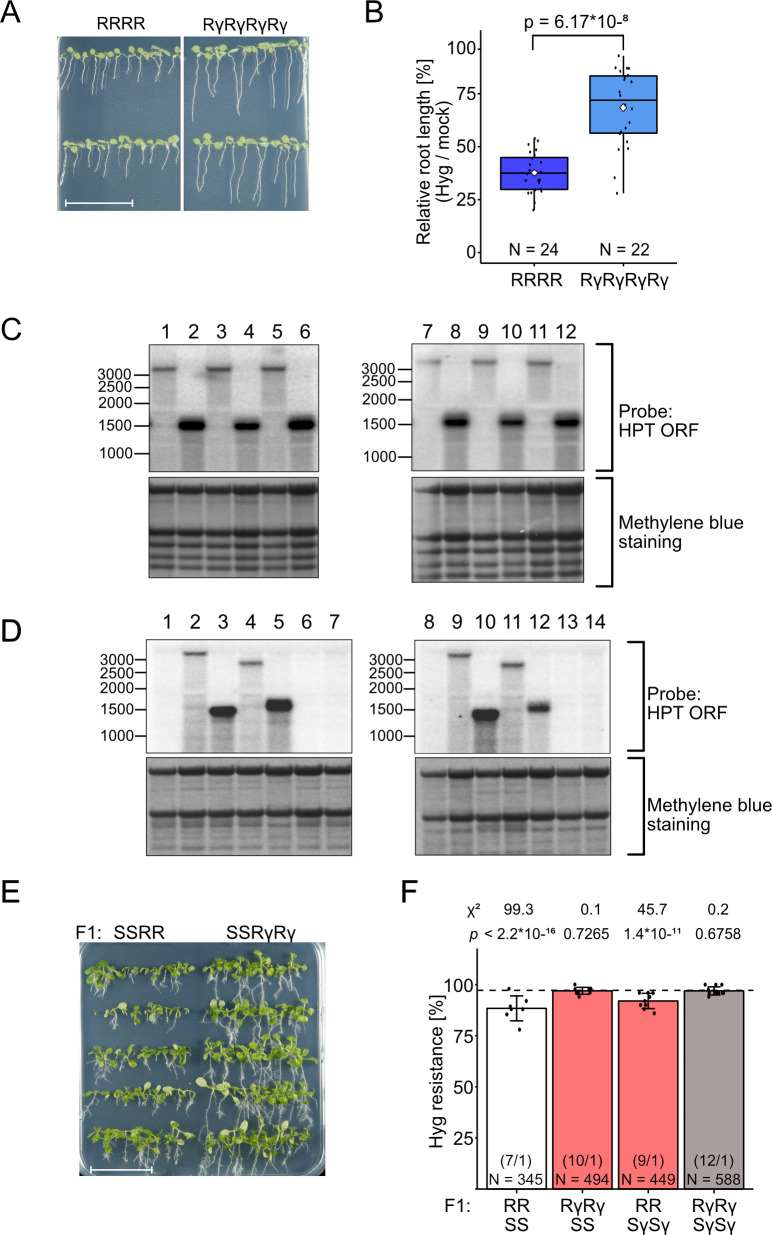
Fig 7. Deletion of the downstream repeated region leads to higher expression at active epialleles and reduces paramutation.
(A) Representative images of root growth assays in the presence of 20 mg/L hygromycin with 7 d-old plants containing full length or truncated active epialleles. Scale bar = 3 cm. (B) Box plots of relative root length on hygromycin versus non-selective medium as in (A) (measured with SmartRoot software). White diamonds indicate the mean of each group. Statistical analysis was performed with Welch’s two sample T-test with indicated p-value. N = number of tested seedlings in each group. (C) Northern blots of HPT transcripts in seedlings of independent lines of tetraploid (1–6) and diploid (7–12) plants with full length (1,3,5,7,9,11) or truncated (2,4,6,8,10,12) active epialleles. (D) Northern blots of HPT transcripts in flower buds of tetraploid (1–7) and diploid (8–14) plants. 1: WWWW; 2: RRRR; 3: RΔ2RΔ2RΔ2RΔ2; 4: RΔ4RΔ4RΔ4RΔ4; 5: RγRγRγRγ; 6: SSSS; 7: SγSγSγSγ; 8: WW; 9: RR; 10: RΔ2RΔ2; 11: RΔ4RΔ4; 12: RγRγ; 13: SS; 14: SγSγ. Location of the probe for blots in C and D is illustrated in Fig 1. (E) Representative image for hygromycin resistance assays with 14 d-old F2 plants after crossing parents with full length or truncated epialleles. Scale bar = 3 cm. (F) Resistance ratios calculated from assays like in (E). Data from reciprocal crosses were combined, statistical analysis is based on a summed Chi-square goodness-of-fit test with indicated values. Number in parentheses: different F2 populations / technical repetitions for each population. N = number of tested seedlings in each group.

