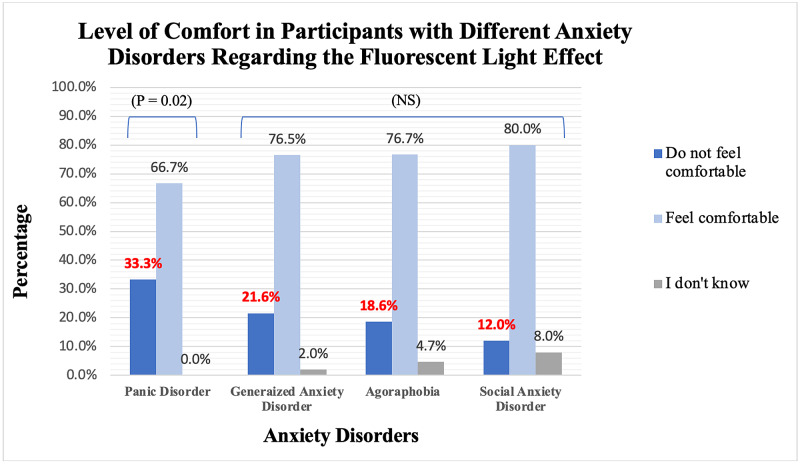
Figure 1. A bar chart representing the association between the participants with different anxiety disorders and the statement “I do not feel comfortable in the lighting of this clinic.” N = 202 participants and the frequencies of the associations were added as well.
P < 0.05 is significant. NS = not significant

