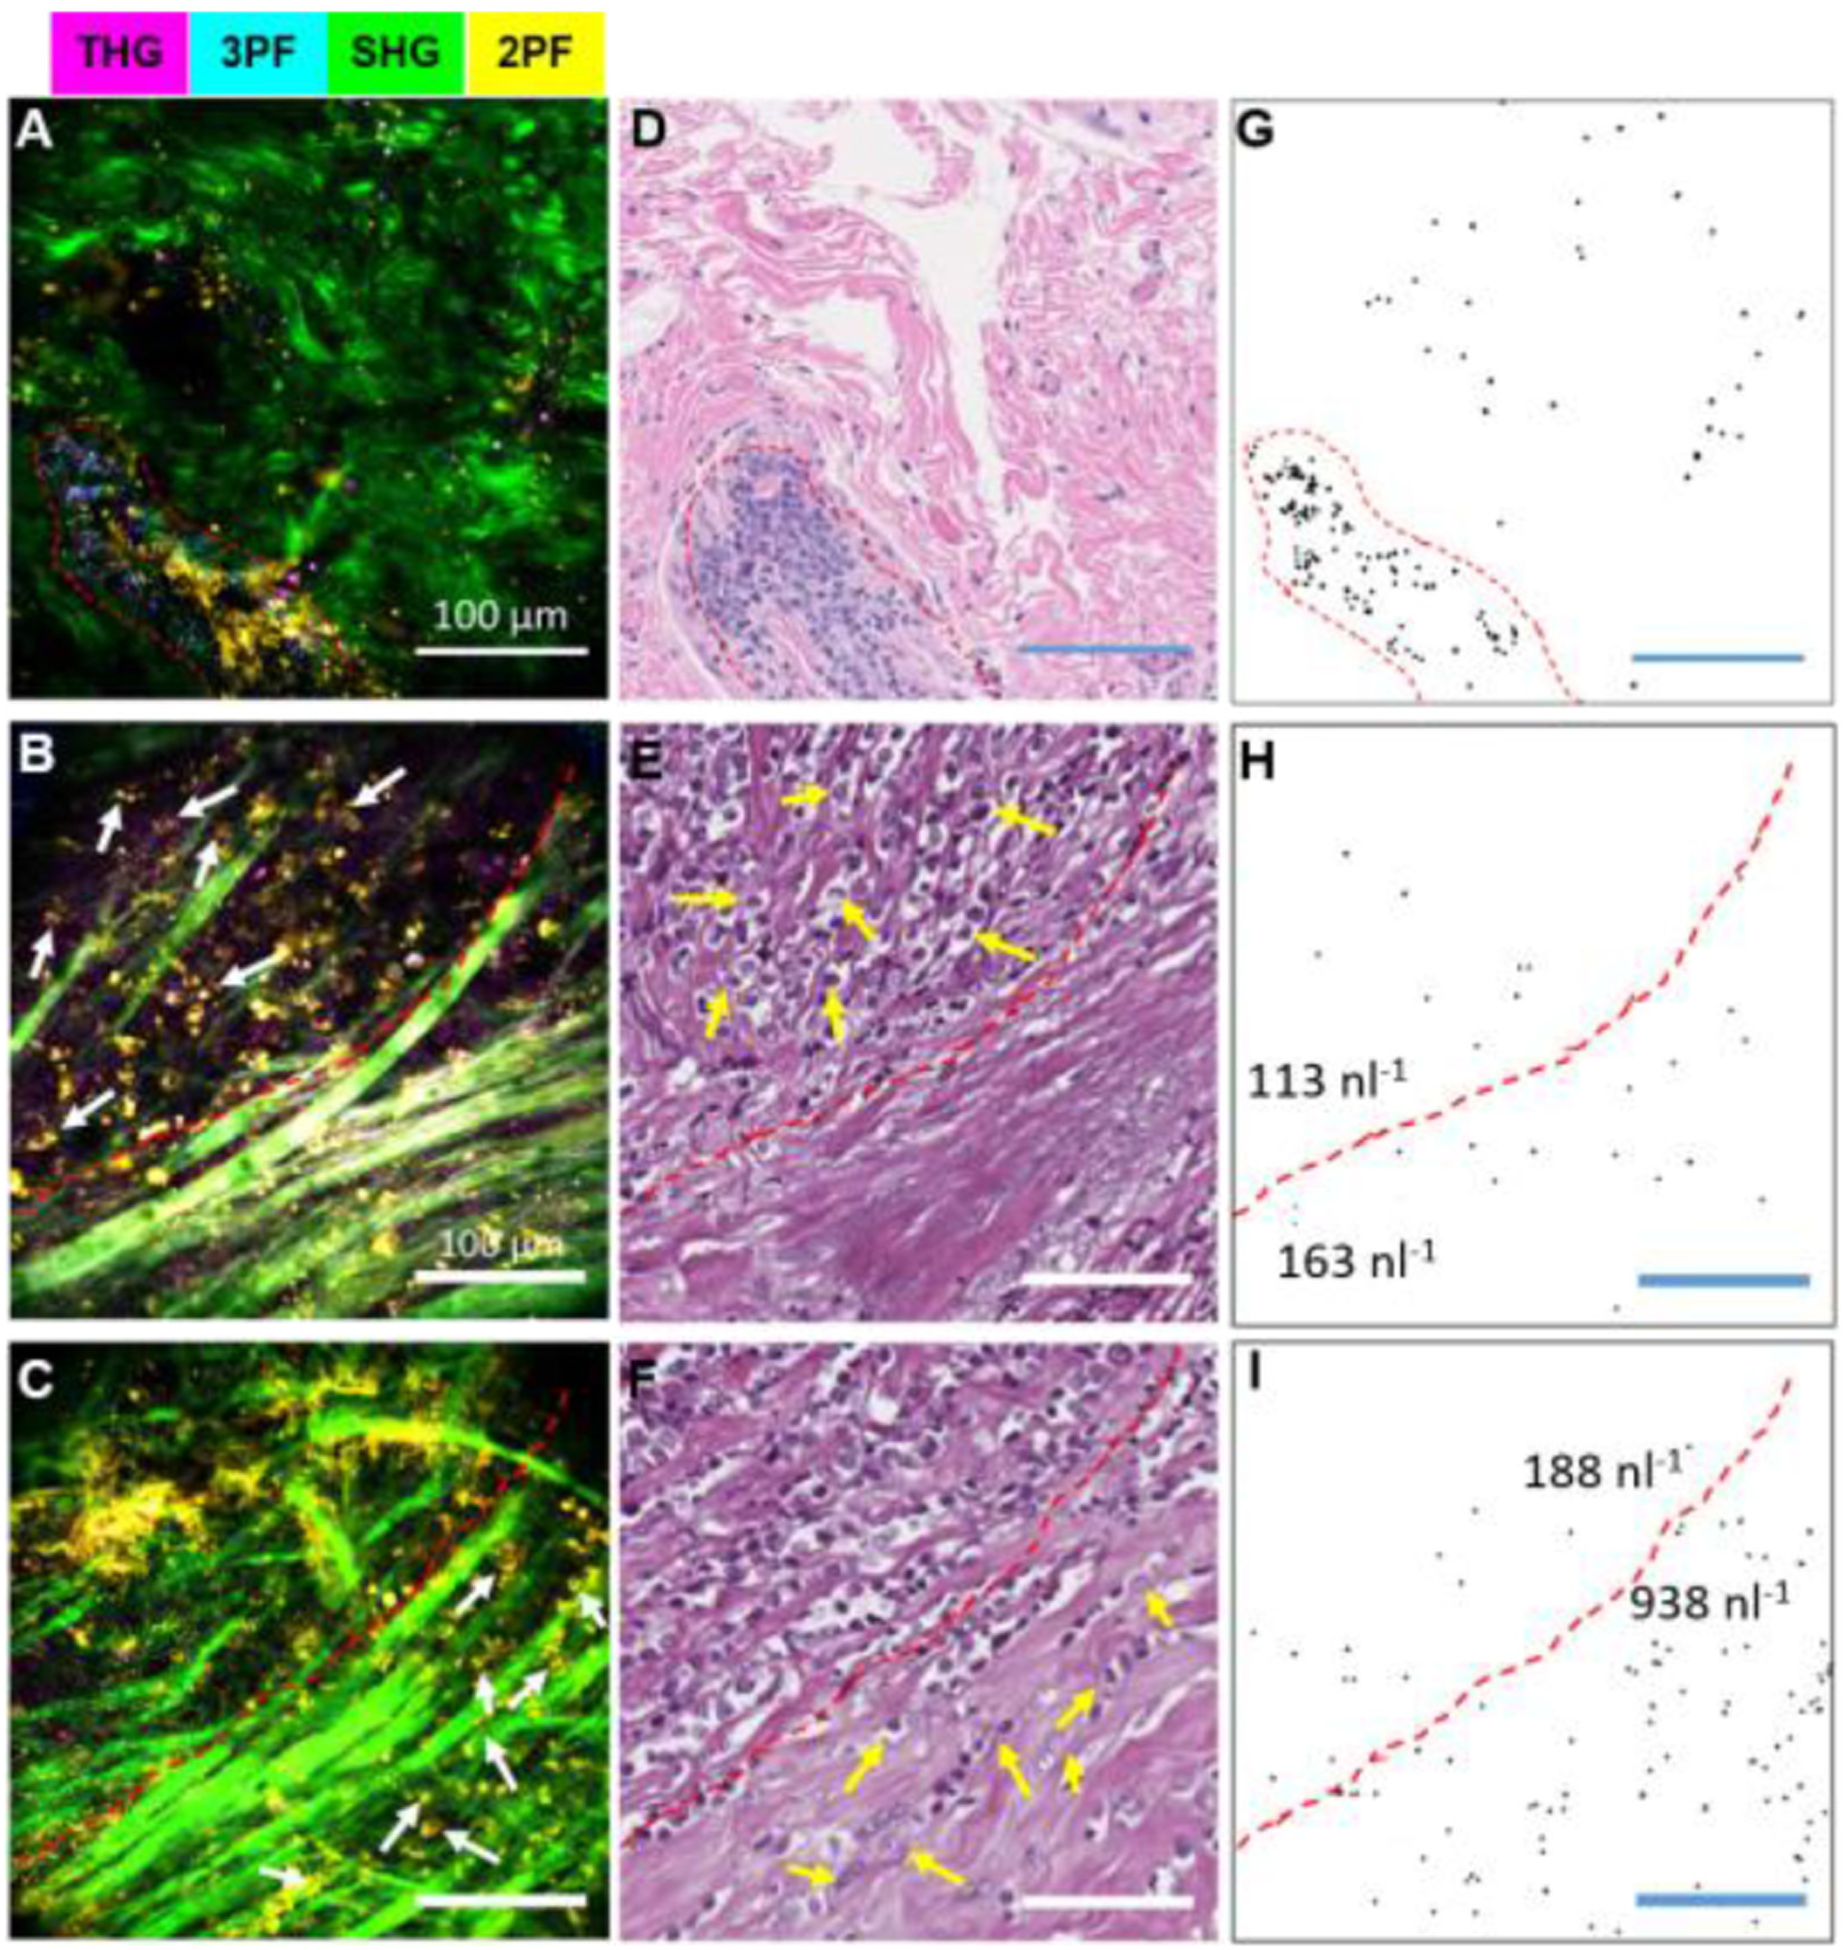
Fig. 5.

Spatial imaging of EV distribution and quantification in the tumor microenvironment. (A)–(C) Label-free multimodal NLOI of human breast tissue specimens with tumor-associated EVs. (D)–(F) Corresponding H&E-stained histology results. (G)–(I) Thresholded binary images of segmented EVs from the THG channel in the multimodal images (A)–(C), respectively. (A), (D), (G) EV enrichment in a region (enclosed by the red dashed line) of DCIS. (B), (E), (H) EVs in a boundary region (white arrows indicating tumor cells) of early-stage desmoplasia. (C), (F), (I) EVs in a region of later-stage desmoplasia with tumor-cell invasion. Note that the red dashed lines in (B), (C), (E), (F), (H), (I) indicate the interface or boundary between the tumor regions and the apparently normal collagen-rich regions. At the early stage of desmoplasia (H), the average EV density was found to be 144 nl−1, and EVs were approximately evenly distributed on each side of the tumor interface. In contrast, at a later stage (I), the average EV density increased to 575 nl−1 with a significantly higher level (938 nl−1) within the collagen-rich region, indicating an up-production of EVs along this interface of invasion. Scale bars represent 100 μm. The color scale is the same as in Fig. 4. Figure reprinted with permission from [66].
