
Fig. 7.
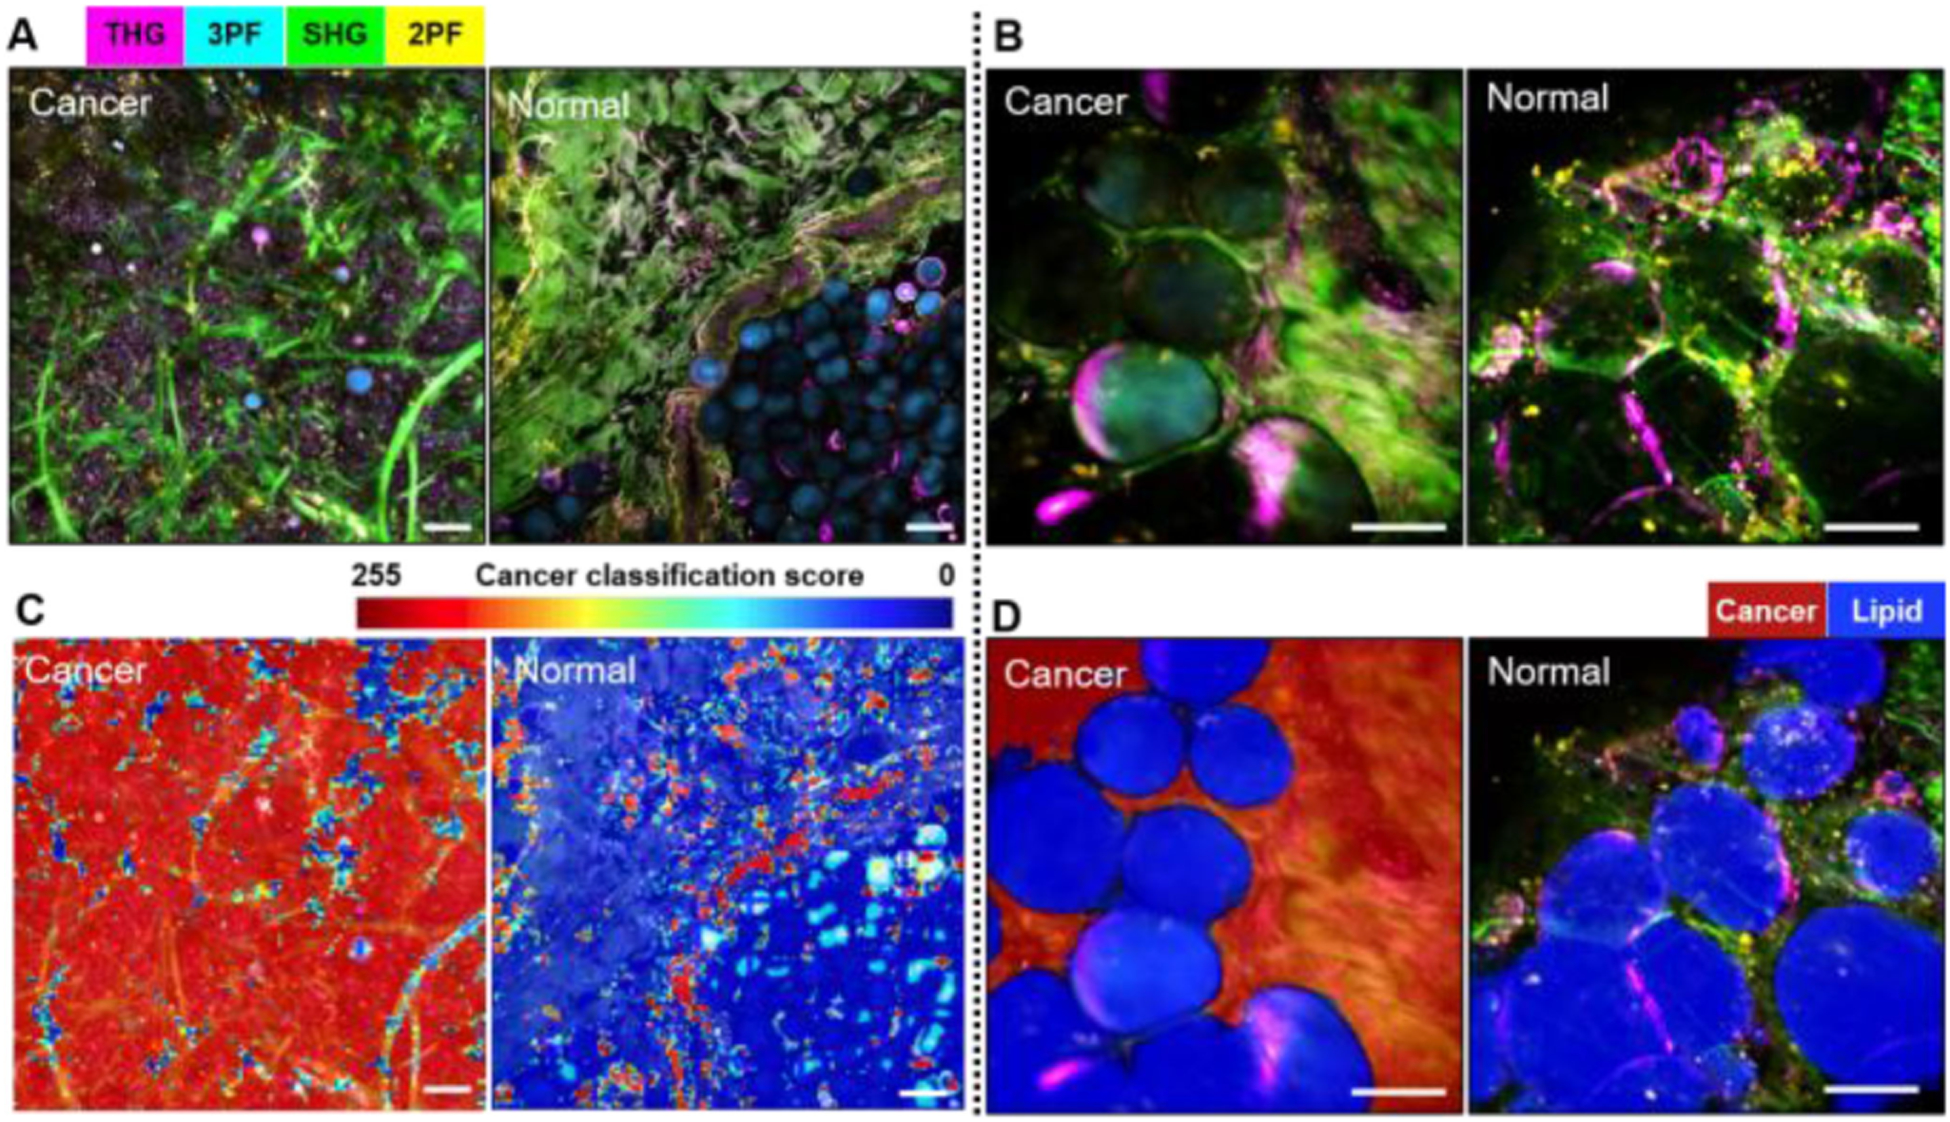
Label-free multimodal NLOI with artificial intelligence and deep-learning classification results. Left panels: (A) SLAM (lab-based) imaging of cancerous (left) and normal (right) human breast tissue along with corresponding classification maps (C). Right panels: (B) Intraoperative label-free multimodal NLOI of cancerous (left) and normal (right) human breast tissue along with corresponding classification results (D). Red indicates high-likelihood cancerous regions and blue is associated with higher lipid content. THG, third-harmonic generation; SHG, second harmonic generation; FAD, flavin adenine dinucleotide; NAD(P)H, reduced nicotinamide adenine dinucleotide. The color scale is shown on the top of (A). Scale bars represent 100 μm. Figure modified and reprinted with permission from [67].