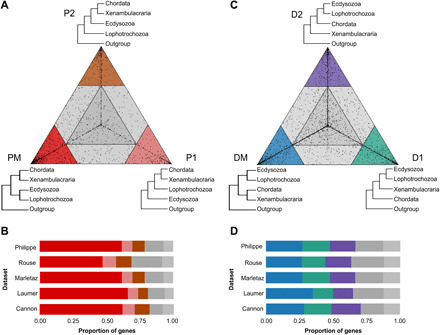
Fig. 2. Most genes prefer monophyletic Protostomia over alternatives; few genes prefer monophyletic Deuterostomia.

Triangular plots showing relative support for the three alternative topologies shown at the corners of the triangles. Genes in colored corners show a high preference for the corresponding topology. The numbers of genes found in the different colored sectors of the large triangle are shown below. (A) Triangle plot comparing support for monophyletic Protostomia (PM) versus two alternative topologies with paraphyletic Protostomia (P1 and P2). (B) Bar plot showing that across five datasets, most genes strongly prefer the monophyletic Protostomia topology. (C) Triangle plot comparing support for monophyletic Deuterostomia (DM) versus two alternative topologies with paraphyletic Deuterostomia (D1 and D2). (D) Bar plot showing that across five datasets, a minority of genes strongly prefer the monophyletic Deuterostomia topology over paraphyletic topologies or the gray areas.
