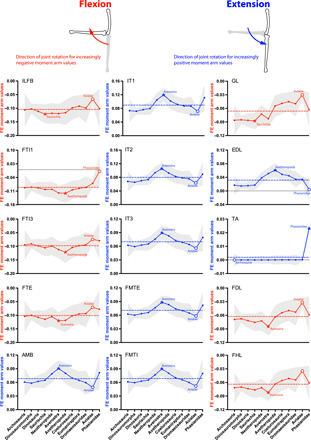
Fig. 6. Mean MTU moment arms (normalized by tibiotarsus length) for knee flexion (red, negative values) and extension (blue, positive values) for the 15 muscles (Fig. 2, C to E, and Table 1) acting around the knee in all taxa (if present), plotted across the ancestral nodes in Fig. 1.

See Fig. 3 caption for further details.
