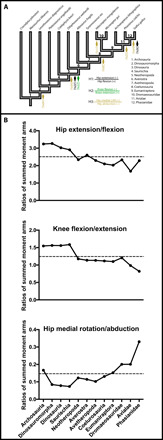
Fig. 8. Results for trends in the ratios of summed (absolute value) moment arm ACE values across the phylogeny of Archosauria (see Fig. 1).

(A) Changes between nodes (numbers 1 to 12) of ≥20% magnitude are emphasized. Hypothesis 1 (H1) is rejected at Neotheropoda = node 5 (and increase at node 12), H2 is supported at node 5, and H3 is supported at node 5 (and nodes 8, 11, and 12; with unexpected decreases and increases at nodes 2 and 10, respectively). “+” and “–“ signs by muscle actions for H1 to H3 indicate signs of (nonabsolute value) moment arms. LAR, long-axis rotation. (B to D) Detailed changes of ratios of summed moment arms across the phylogeny of Archosauria, used for inferences in (A).
