


Fig. 2. High-dimensional cell analysis of CD8+ T cells identifies TEN-enriched immunophenotypes.
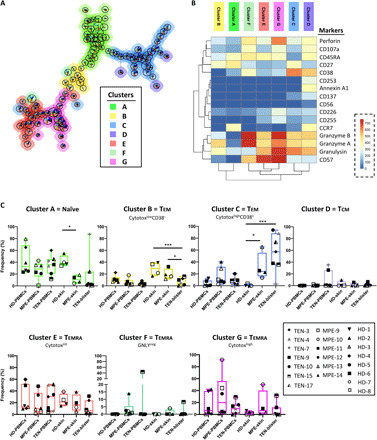
FlowSOM analysis with automatic consensus clustering was performed on concatenated CD8+ T cell data (300 cells per sample) from both lesion (blisters/skin) and PBMC samples from patients with TEN, patients with MPE, and healthy donors (HD). (A) Results were presented as minimal spanning tree (MST) of 100 nodes gathered in seven background colored clusters (A to G). Each node includes phenotypically similar cells, and the size of the node indicates the number of cell events. See MST magnification in fig. S4 to understand marker expression in respective SOM nodes. (B) Heatmap of the integrated MFI of 16 markers across the seven FlowSOM clusters identified in (A). The color in the heatmap represents the median of the arcsinh for each cluster (centroid) with 0 to 1 transformed marker expression. Clusters (columns) and markers (rows) were hierarchically metaclustered using Ward’s method to group subpopulations with similar phenotype. (C) Cluster frequencies were determined for each sample from each individual to understand tissue abundance. Statistics compared frequencies of each cluster in PBMC or skin samples versus the frequency of the respective cluster in healthy donor samples. *P < 0.05 and ***P < 0.01, Mann-Whitney test (two tailed). GNLY, granulysin.