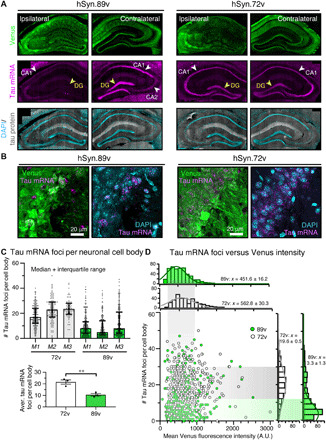
Fig. 3. Effective tau mRNA repression in individual ZFP-TF–expressing neurons.

(A) Coronal brain sections from hSyn1.89v-injected mice immunolabeled for Venus (green) and tau protein (gray) and hybridized with fluorescently labeled mouse tau-specific RNA probe (pink). Already after 2 weeks, hSyn1.89v-injected hippocampi show a pronounced reduction in neuronal tau mRNA signal in the dentate gyrus (DG) and CA1 compared to hSyn1.72v-expressing hippocampi. (B) Individual neuronal cell bodies (=soma including nucleus) in CA2 were analyzed for tau mRNA foci. (C) Number of tau mRNA foci per cell body in CA2 and CA3: hSyn1.72v-injected mice: 18 to 24 foci per cell body, with 21.6 ± 1.8 (means ± SEM) foci across mice; hSyn1.89v-injected mice: 9 to 13 foci per cell body with 10.6 ± 1.1 foci per cell body across mice. Data are presented as means ± SEM for each mouse (M1 to M3) and each group, n = 60 to 215 neurons per mouse, three animals per group. Two-tailed Student’s t test. (D) Two-dimensional histogram of the distribution of tau mRNA foci per Venus+ neuron (y axis) and the corresponding neuronal Venus intensity (x axis). The most probable number (from Gaussian fit to distribution; means ± SD) of foci is ~20 in hSyn1.72v- and ~3 in hSyn1.89v-expressing neurons. No correlation between tau mRNA foci and Venus fluorescence intensity is apparent in hSyn.89v neurons. Same data as in (C). A.U., arbitrary units.
