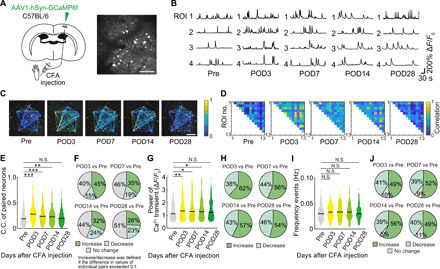
Fig. 2. Tracking neuronal activity in individual neurons during the progression of persistent pain.

(A) Schematic diagram showing virus injection. WT mice were injected with AAV1-hSyn-GCaMP6f into the hindlimb region of primary somatosensory cortex (S1HL) to enable in vivo Ca2+ imaging of S1HL neurons. Responses from the same neurons were traced pre- and post-CFA injection (pre and days 3, 7, 14, and 28). Scale bar, 100 μm. (B) Representative calcium traces from four typical neurons, traced at different times before and after CFA injection. (C and D) Representative examples of C.C. (color coded) for specific neuronal pairs as indicated by connected lines in (C), from pre- to post-CFA injection. (E, G, and I) C.C. of paired neurons, pCa2+, and frequency of Ca2+ transients (n = 643 pairs, 97 neurons per seven mice) before and at specified times post-CFA. *P < 0.05, **P < 0.01, and ***P < 0.001; paired t test. (F, H, and J) Pie charts of the distribution of changes in C.C., pCa2+, and frequency of Ca2+ transients at times before and after CFA using the same dataset as in panels (E), (G), and (I). An increase or decrease in C.C. was defined if the difference was greater than 0.1.
