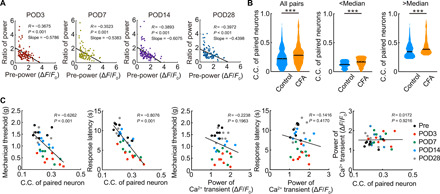
Fig. 4. Relationship between resting activity and increases in power and C.C.

(A) Scatterplot of the relative increase in neuronal pCa2+ for each neuron during inflammatory pain, plotted against the basal pCa2+ before pain, and shown at four different days postoperation (n = 97 neurons per seven mice, Pearson’s correlation test). (B) Comparison of C.C. of paired neurons in control and inflammatory pain model mice (day 3 after CFA injection). In the center and right columns, the data were stratified into neurons with low-basal pCa2+ and higher pCa2+ (using median pCa2+ as the cutoff). A similar difference in C.C. was seen in both these cohorts. ***P < 0.001, Mann-Whitney U test. Violin plots show median (black lines) and distribution of the data. (C) Scatterplots of pain behavioral responses (mechanical threshold or escape response latency during thermal stimulation) against the neuronal C.C. or pCa2+. A significant negative correlation existed for C.C. against pain behaviors but not for pCa2+. There was no relationship between C.C. and pCa2+. Data from pre- and post-CFA neuronal responses, as shown in Fig. 2 [n = 7 mice for (C), regression lines show by Pearson’s correlation test].
