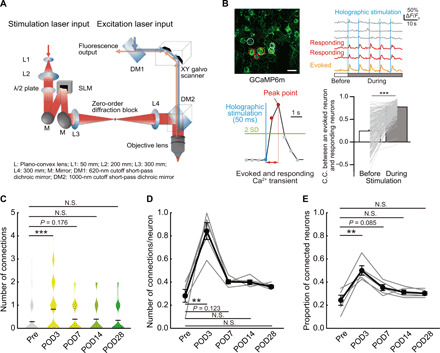
Fig. 5. Increased functional connectivity of L2/3 S1HL neurons in CFA-injected mice.

(A) Schematic diagram of holographic stimulation combined with two-photon microscope. (B) Representative images of S1 neurons expressing GCaMP6m. The stimulated neuron is circled in orange; responding and nonresponding neurons are circled in red and gray, respectively. Scale bar, 10 μm. Corresponding Ca2+ traces in these neurons, with the blue vertical lines (holographic stimulations) are shown (top). A schematic evoked Ca2+ response is shown. The C.C. between the stimulated and responding neurons is compared under spontaneous conditions and following stimulation (bottom; n = 230 pairs per five mice, paired t test). (C) Distributions of responding neurons from pre- to post-CFA injection [n = 5 mice, n = 72 (Pre), 75 (POD3), 77 (POD7), 77 (POD14), and 77 (POD28) neurons, Mann-Whitney U test]. Violin plot shows mean (black lines) and distribution of the data. (D) Proportion of neurons responding to each single neuron stimulation, measured pre- and post-CFA injection in the same animals (n = 5 mice, paired t test). (E) Proportion of stimulated neurons that could elicit responses in adjacent neurons. Changes in these connected neurons compared from pre- to post-CFA injections in the same animals (n = 5 mice, paired t test). **P < 0.01 and ***P < 0.001.
