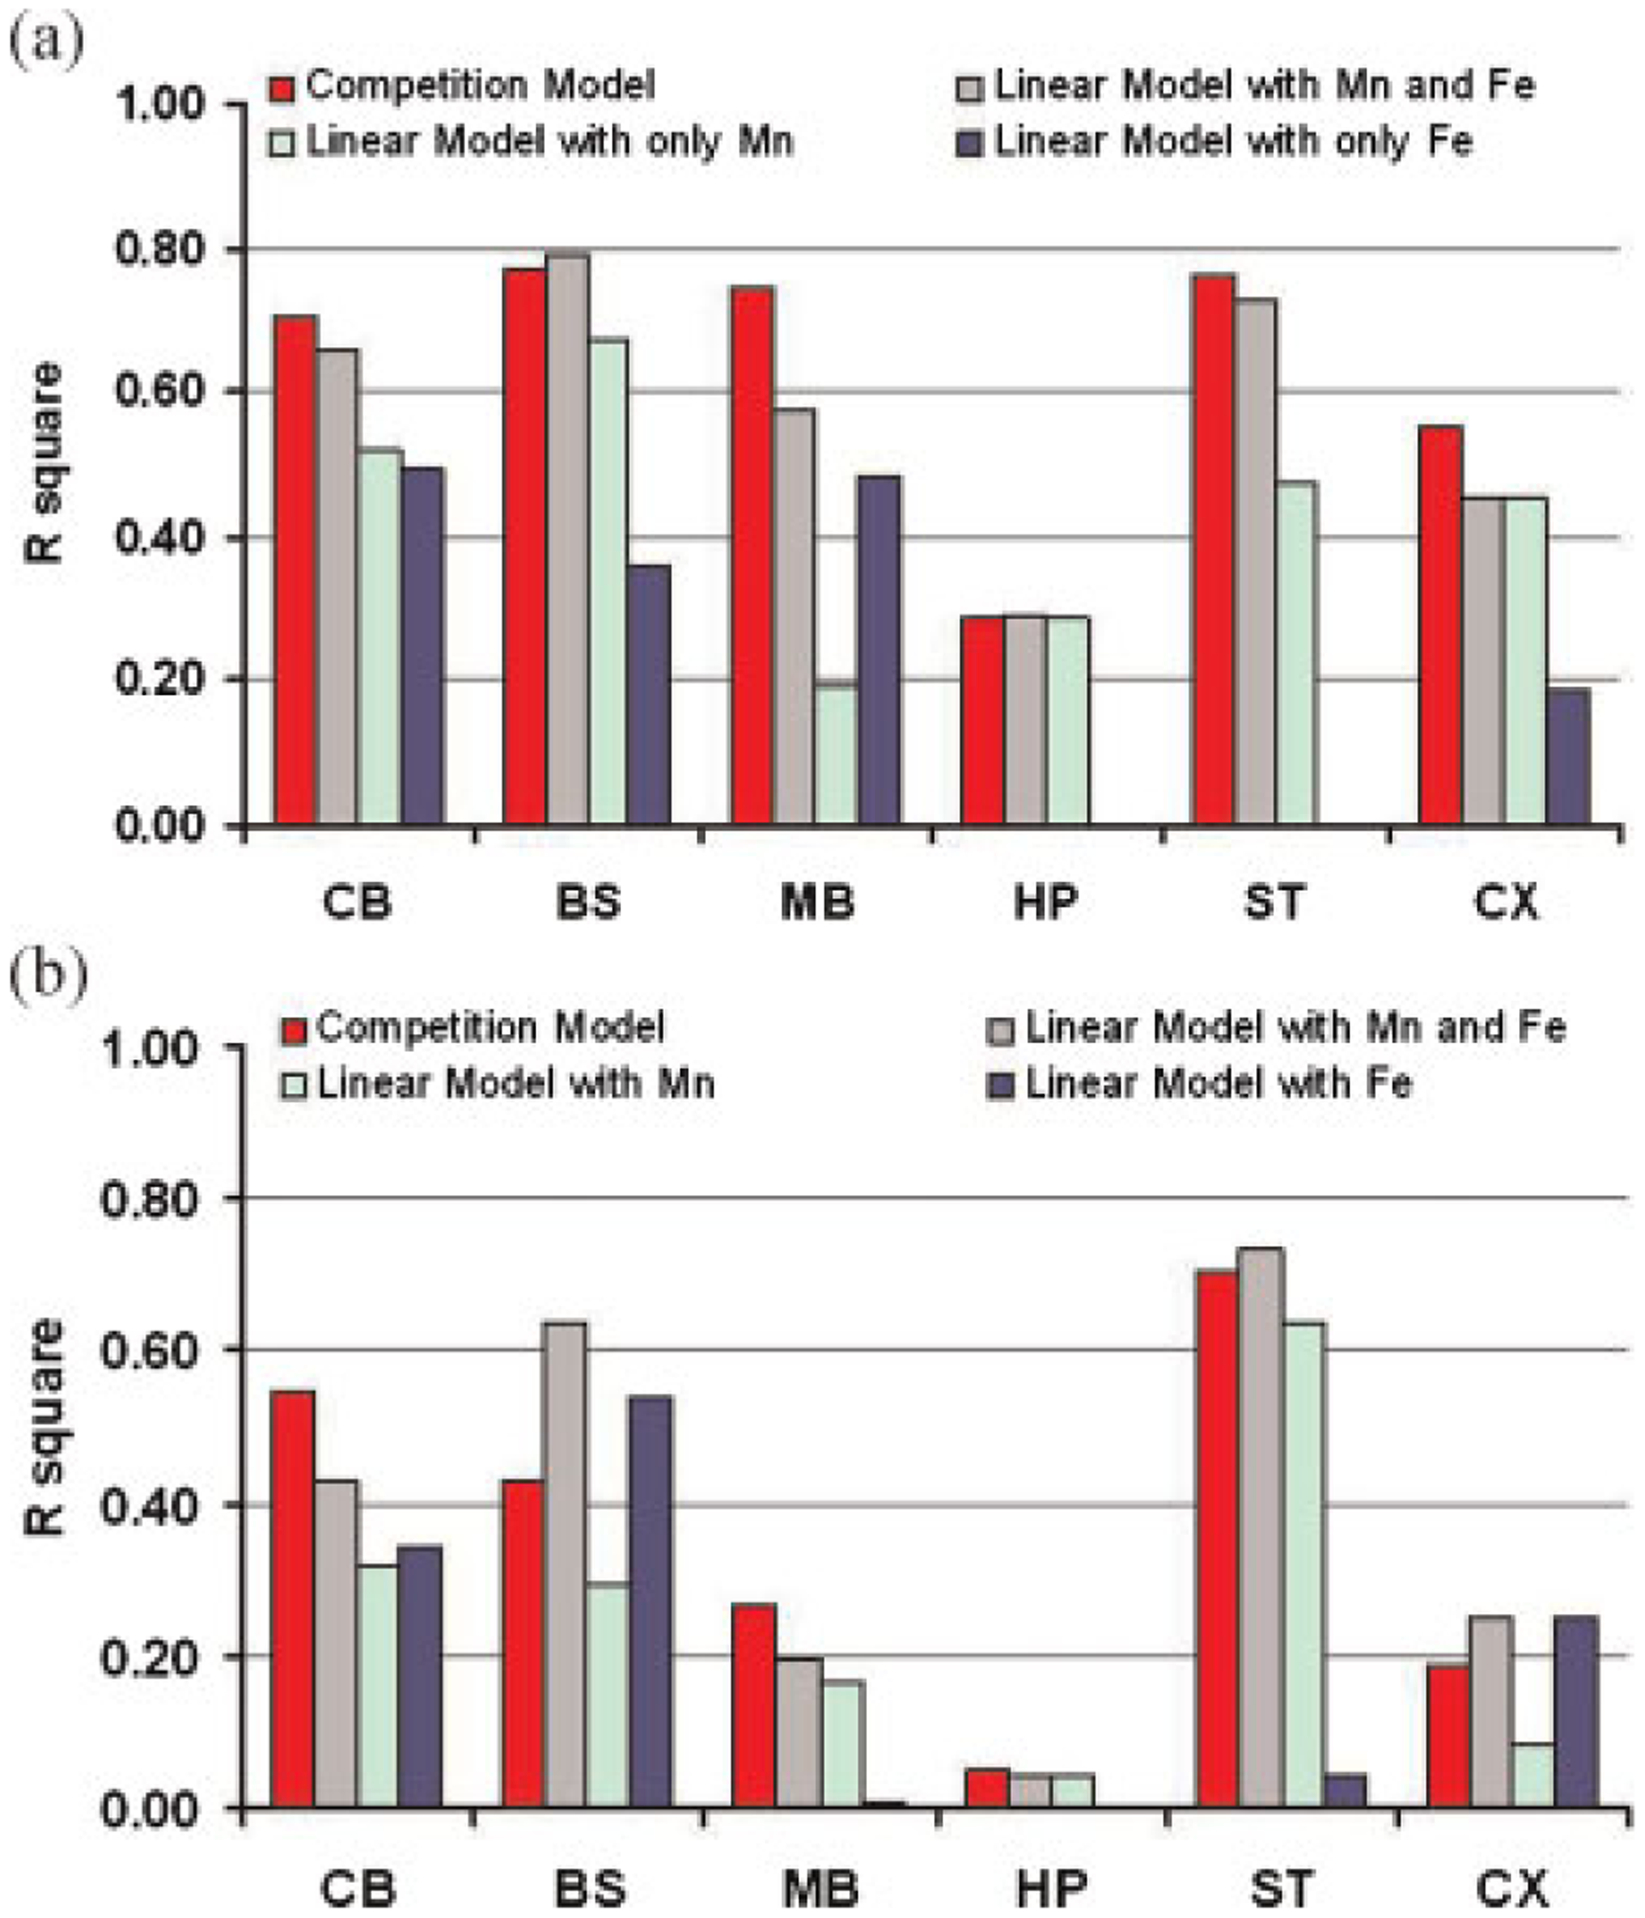
Figure 5.

Square of the correlation coefficient between the measured relaxation rate and the predicted relaxation rate derived by competition and linear models. (a) r2 of measured R1 versus fitted R1 as results of using competition and linear models. (b) r2 of measured R2 versus fitted R2 as results of using competition and linear models. CB, cerebellum; BS, brainstem; MB, midbrain; HP, hippocampus; ST, striatum; CX, cortex.
