Figure 1.

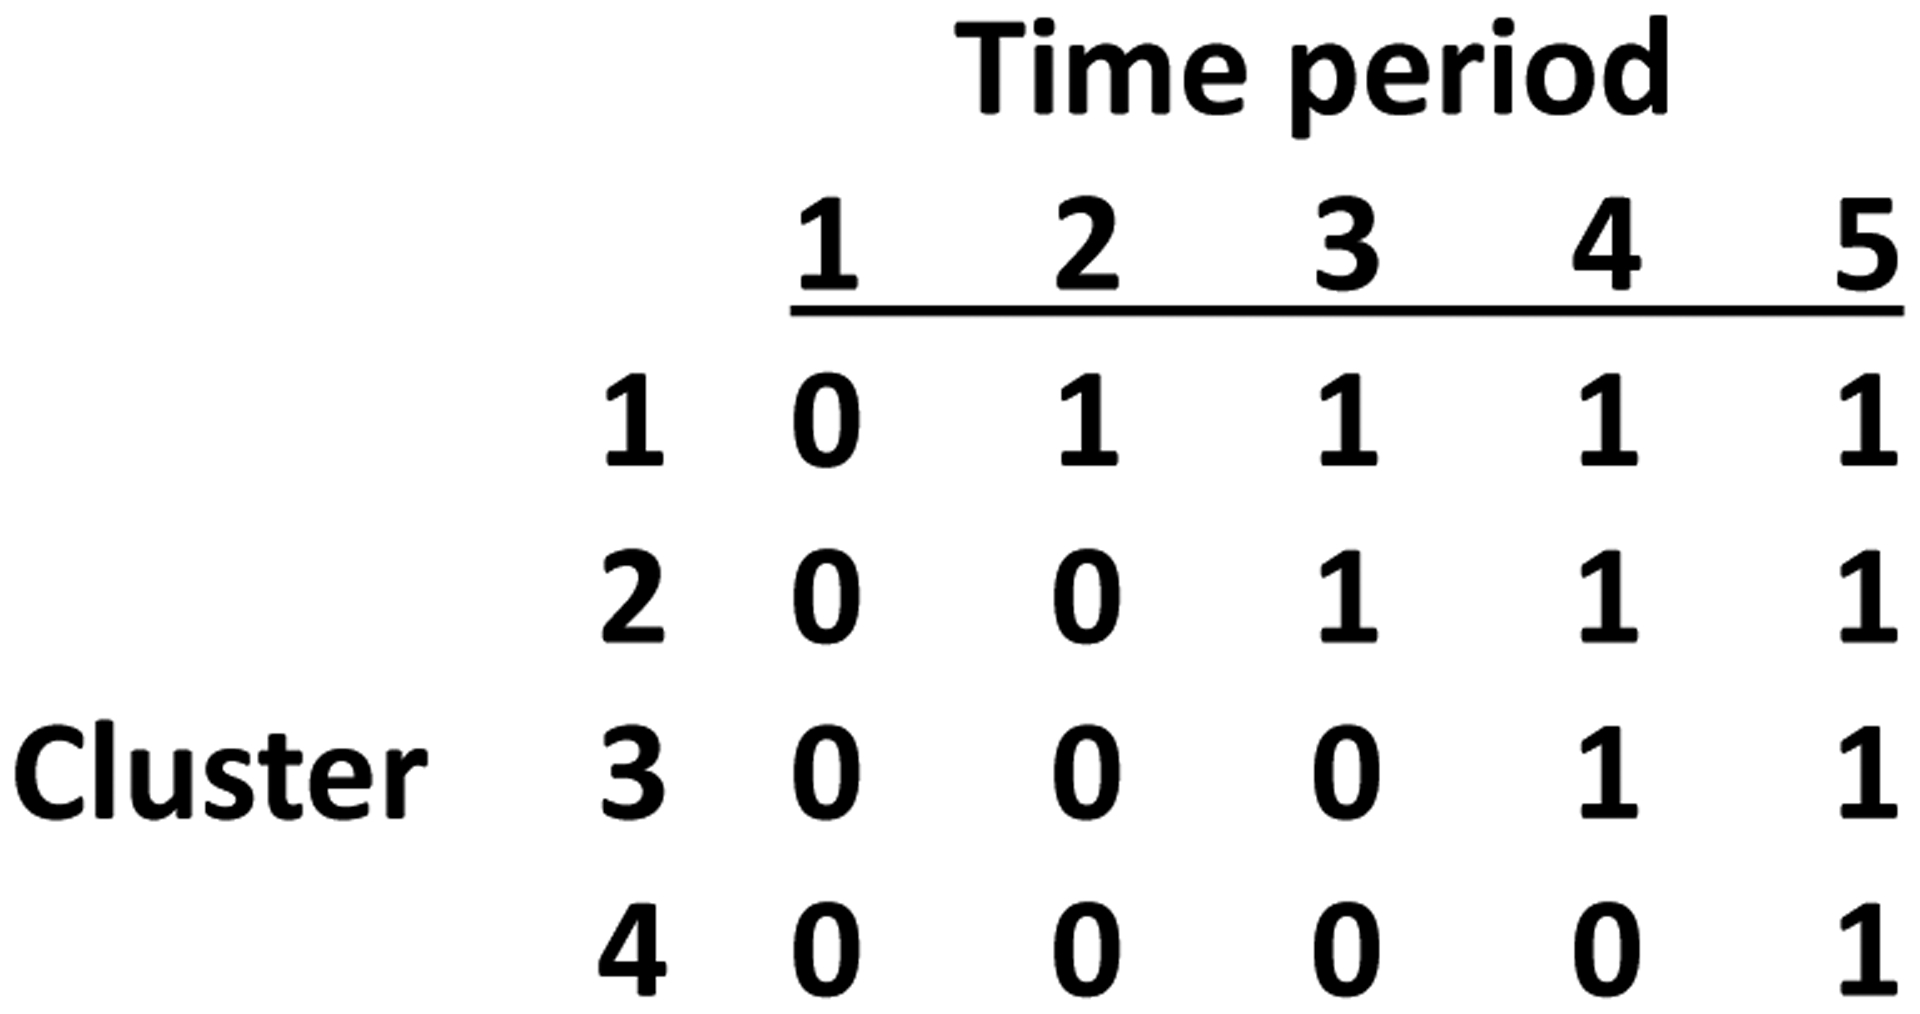
Schematic representation of stepped wedge designs with 4 intervention sequences, one cluster per sequence, and 5 time periods. 0 indicates control condition and 1 represents treatment.

Schematic representation of stepped wedge designs with 4 intervention sequences, one cluster per sequence, and 5 time periods. 0 indicates control condition and 1 represents treatment.