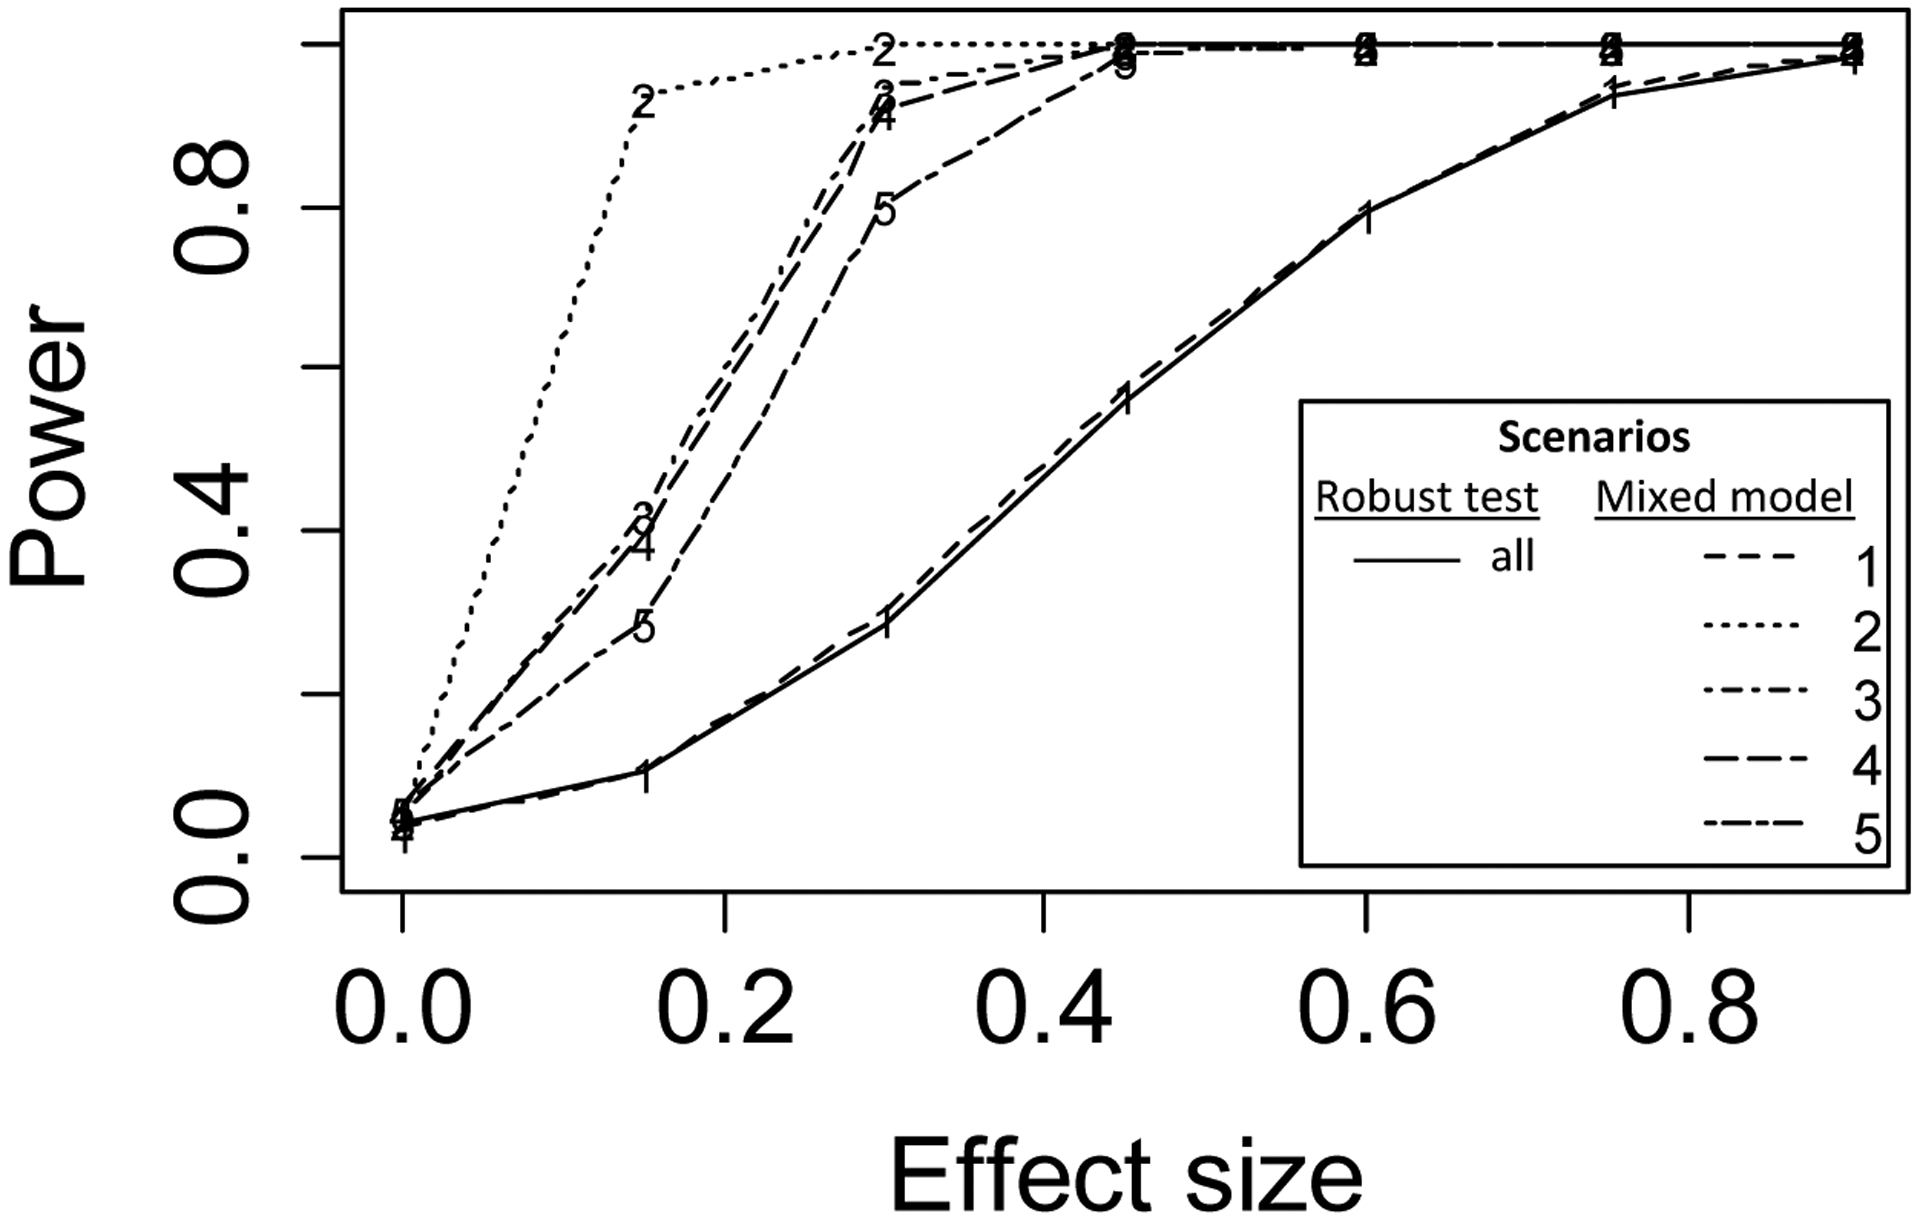
Figure 2.

Power curves for testing Ho: δ = 0 computed across 1000 simulations for the robust test proposed here (solid line, using versus an asymptotic test based on the correctly specified model for the five scenarios described in table 1 (dashed and dotted lines labeled 1 – 5). Note: The scenarios were constructed so that the power curves for the robust test were identical across scenarios; specifically, the intraclass correlations (ICC) for the cluster, intervention and time random effects (when included) were set at 0.17, 0.091 and 0.038, respectively, and σ2 was varied by scenario.
