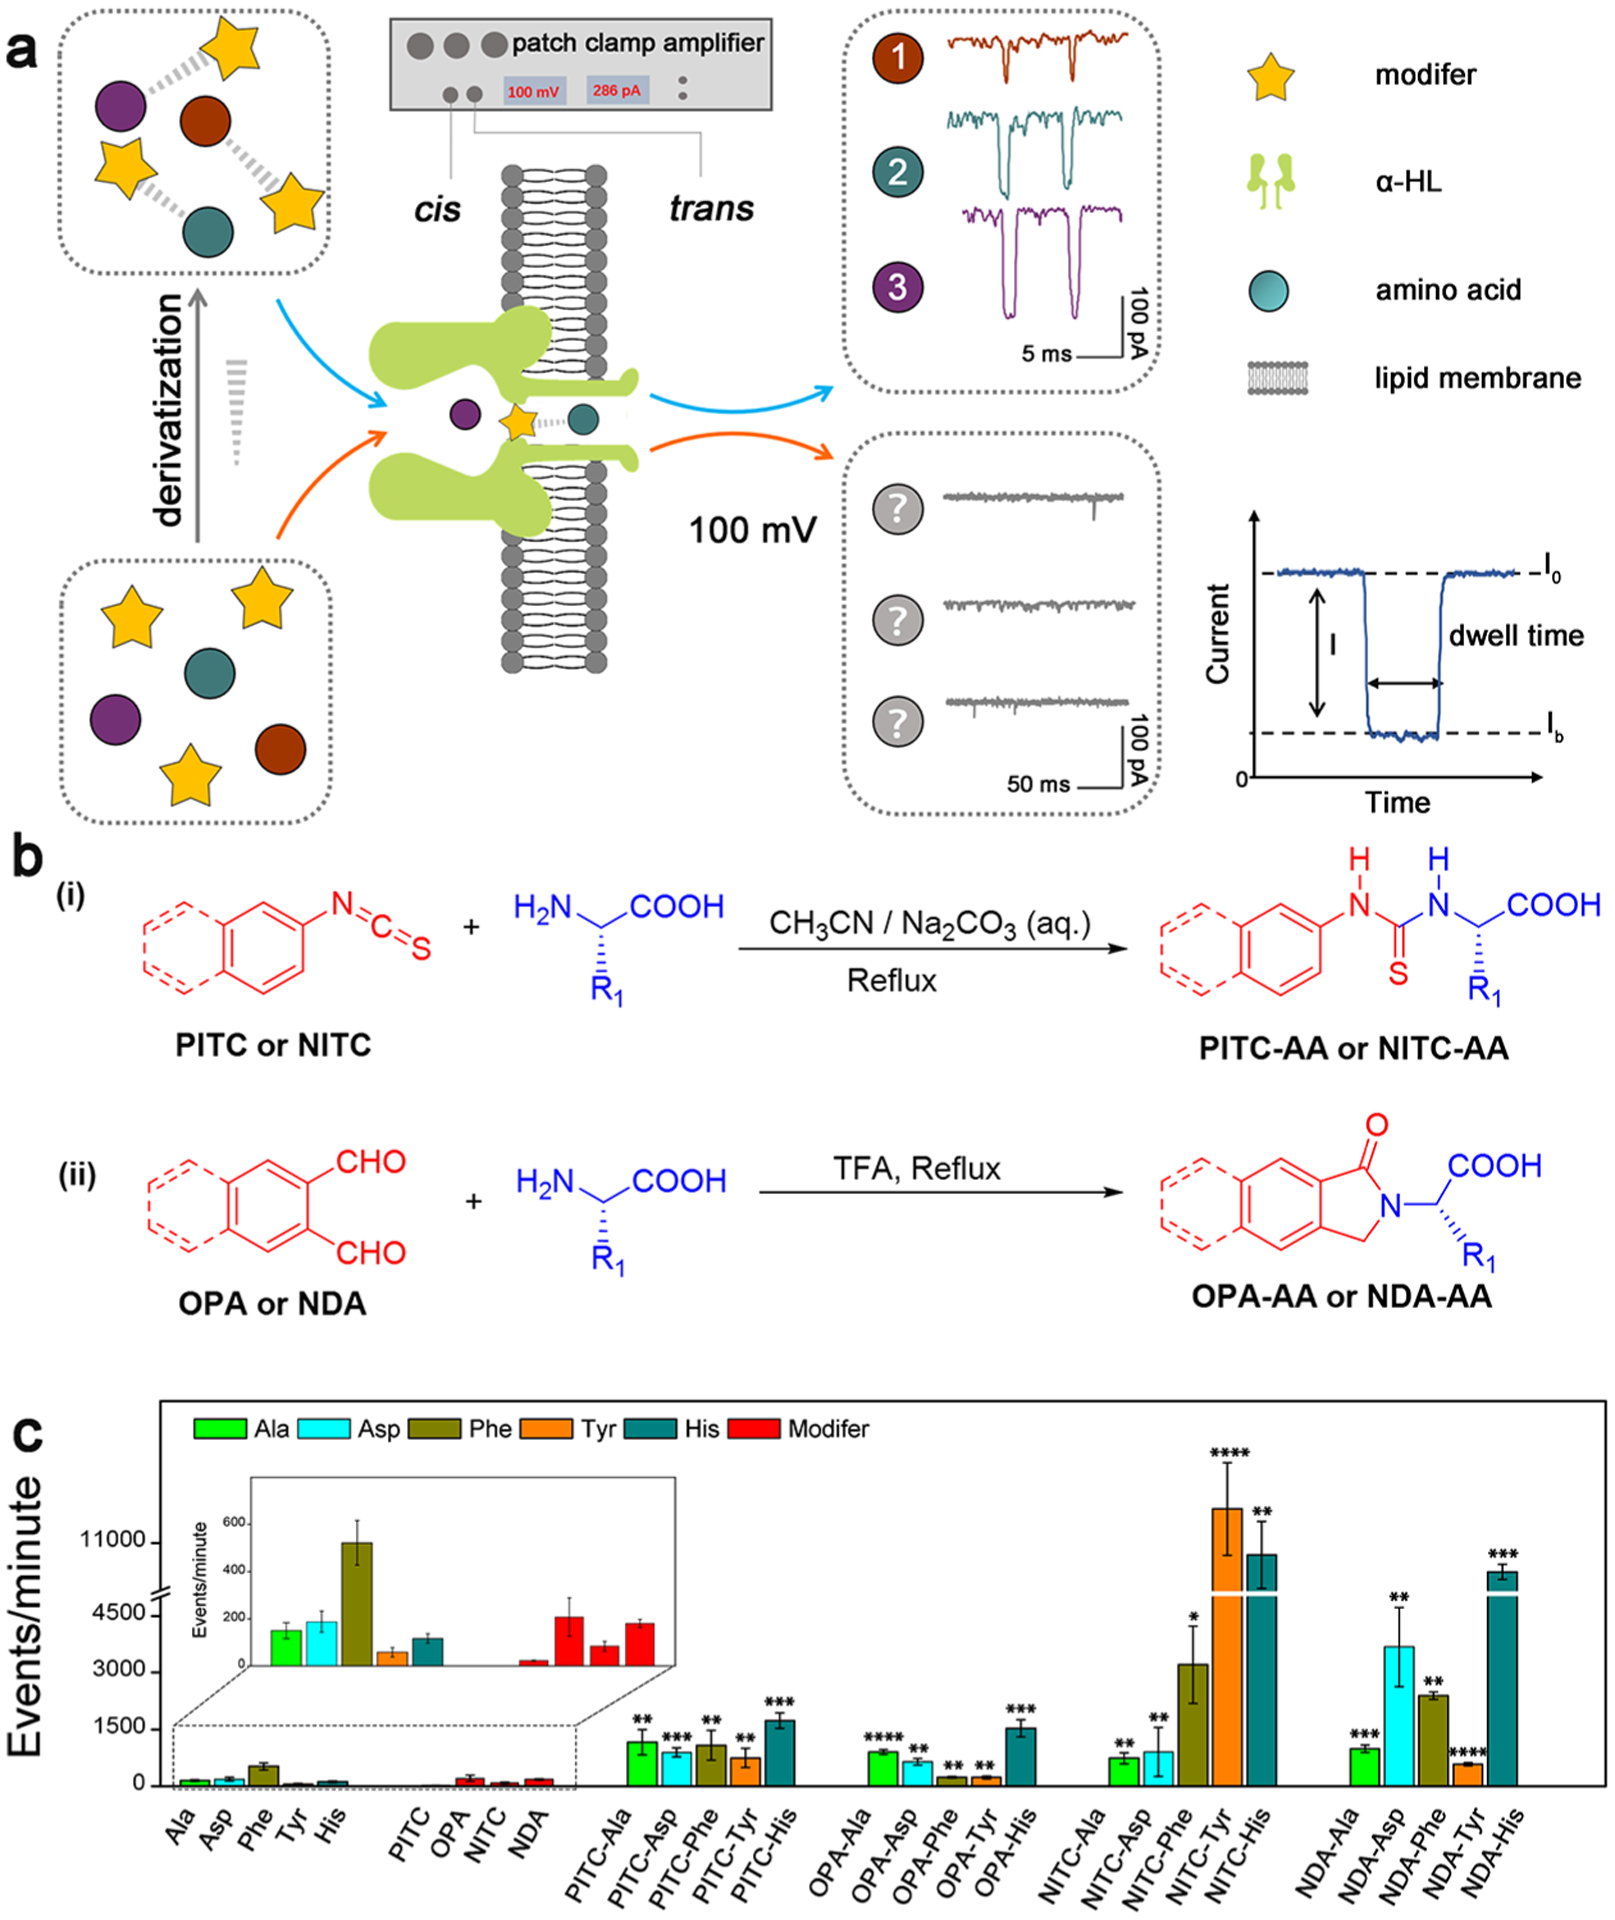
Figure 1.

(a) Schematic illustration of the identification strategy of single AA derivatives through α-HL nanopore. The characteristic signals 1, 2, and 3 are from NITC-Ala, NITC-His, and NITC-Tyr, respectively. (b) Synthetic routes of different AA derivatives. Route i is for PITC/NITC derivatives; route ii is for OPA/NDA derivatives. (c) Translocation events frequency of raw materials and various derivatives through α-HL nanopores under the same experimental condition. Statistical significance is shown between derivatives and corresponding single AA (*: 0.01 < p <0.05; **: 0.001 < p < 0.01; ***: 0.0001 < p < 0.001; and ****: p < 0.0001).
