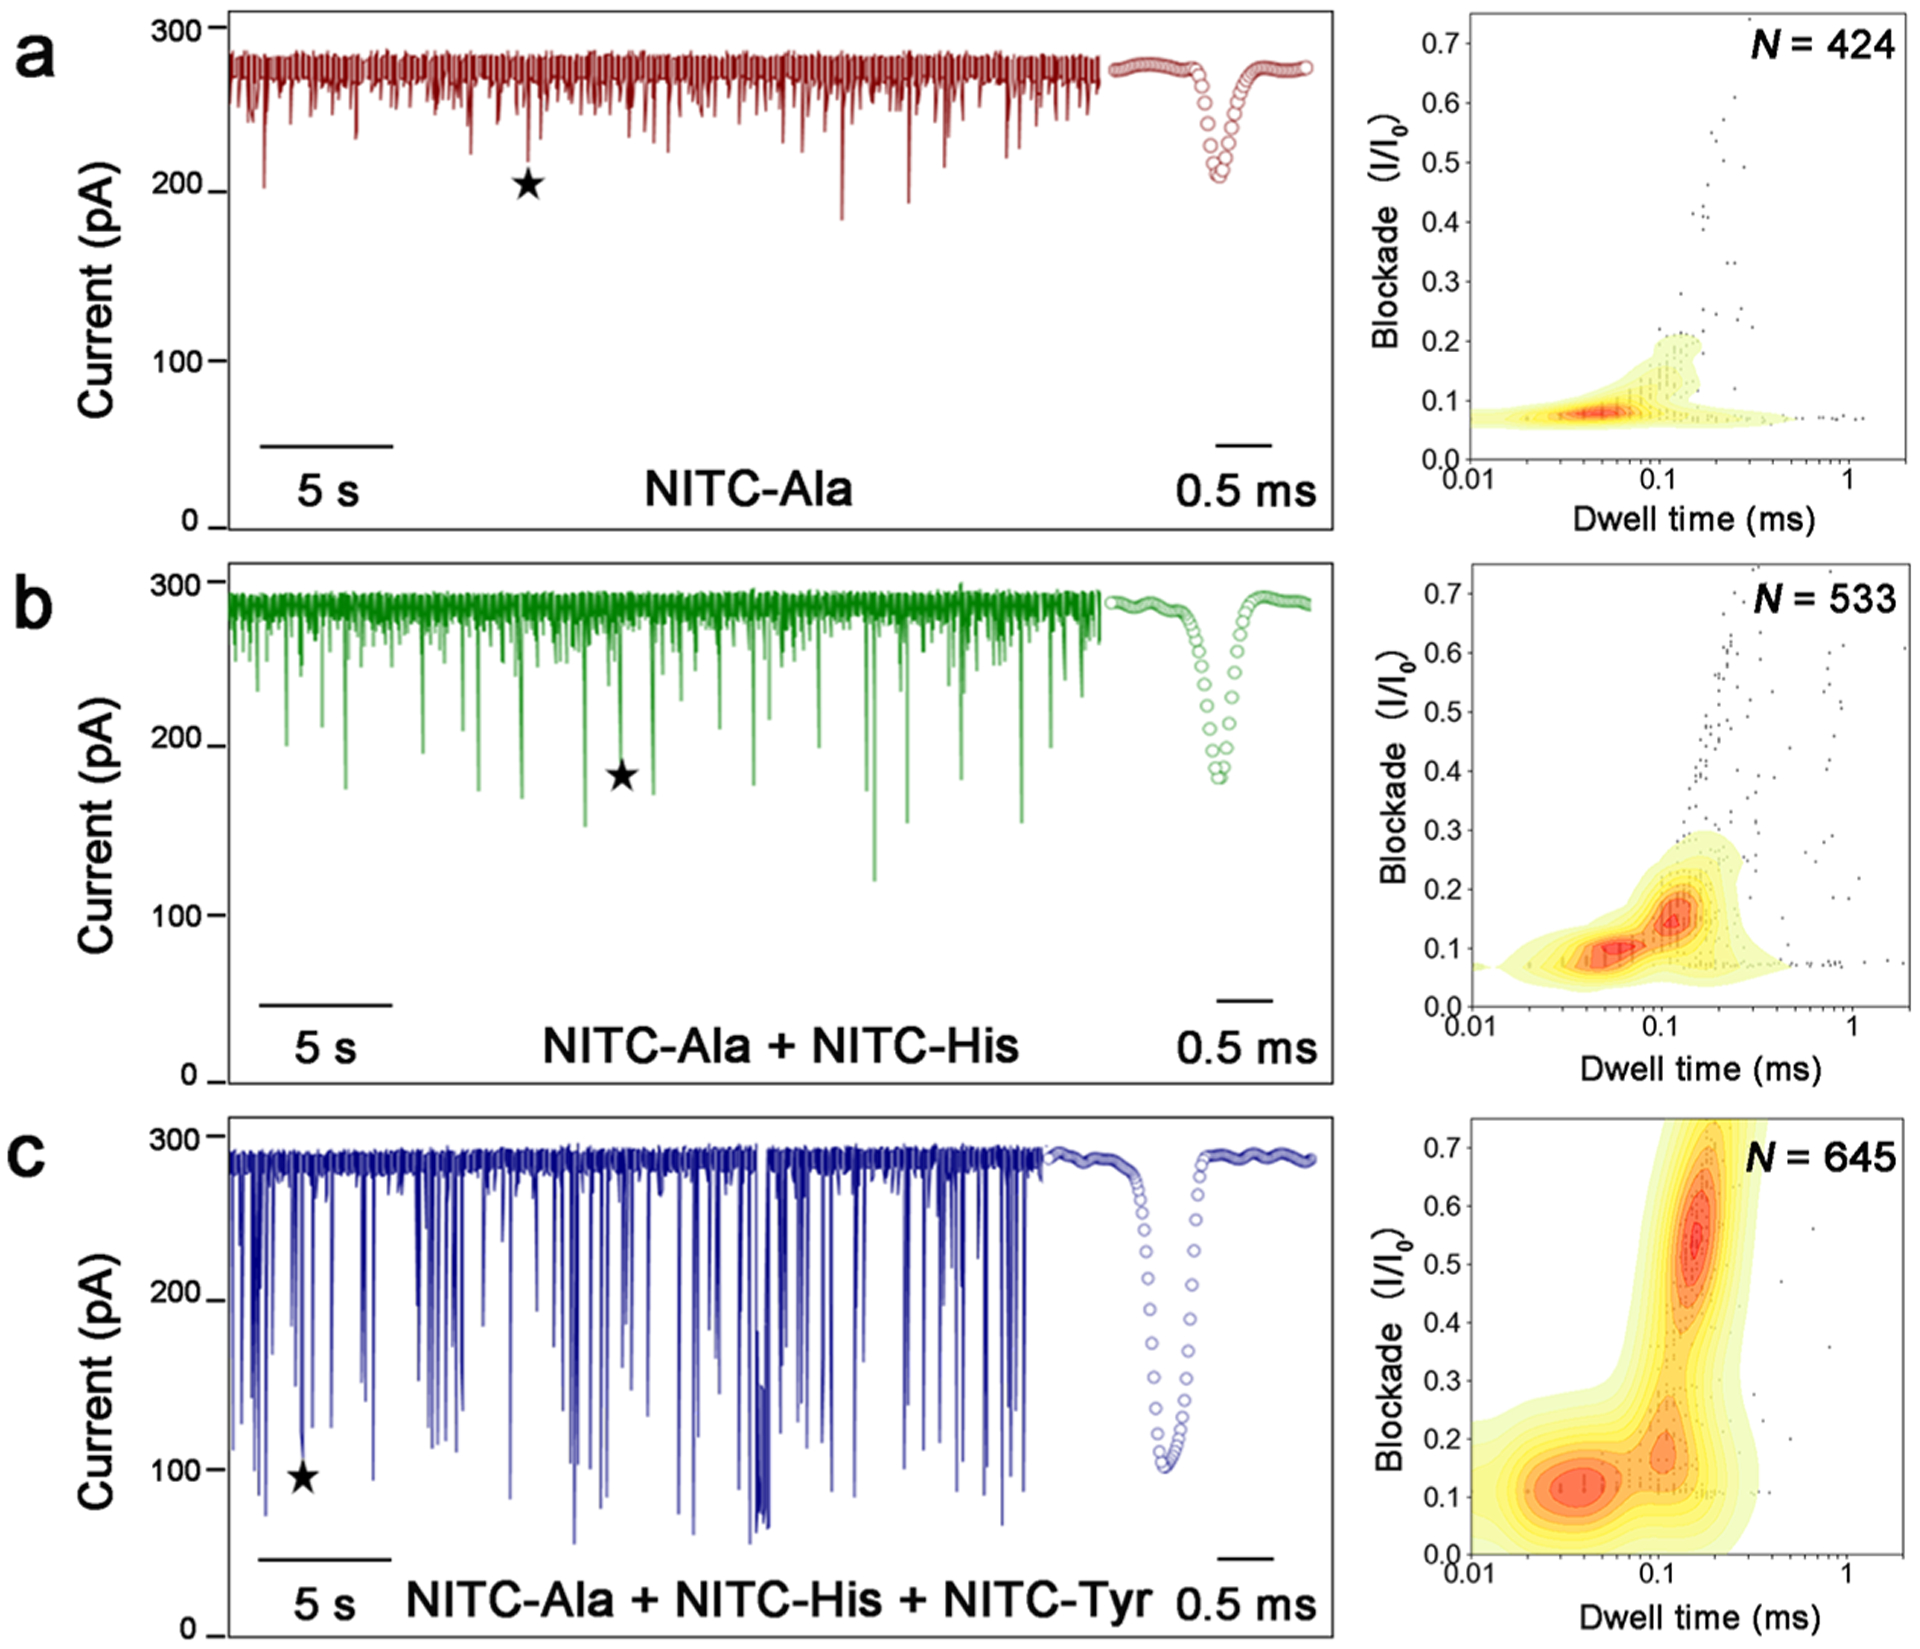
Figure 4.

Discrimination of each AA in a mixture sample. After a single α-HL nanopore was obtained in the working buffer (3 M KCl, 10 mM Tris-HCl, pH 8.0), 200 μM NITC-Ala, 200 μM NITC-His, and 200 μM NITC-Tyr were sequentially added to the cis compartment with 5 min intervals. (a–c) Representative current trace of translocations (left) obtained and contour plots depicting current blockade vs dwell time distributions of all translocation events (right) for (a) NITC-Ala, (b) NITC-Ala and NITC-His, and (c) NITC-Ala, NITC-His, NITC-Tyr. The stars denote the typical spike signals shown in the inset.
