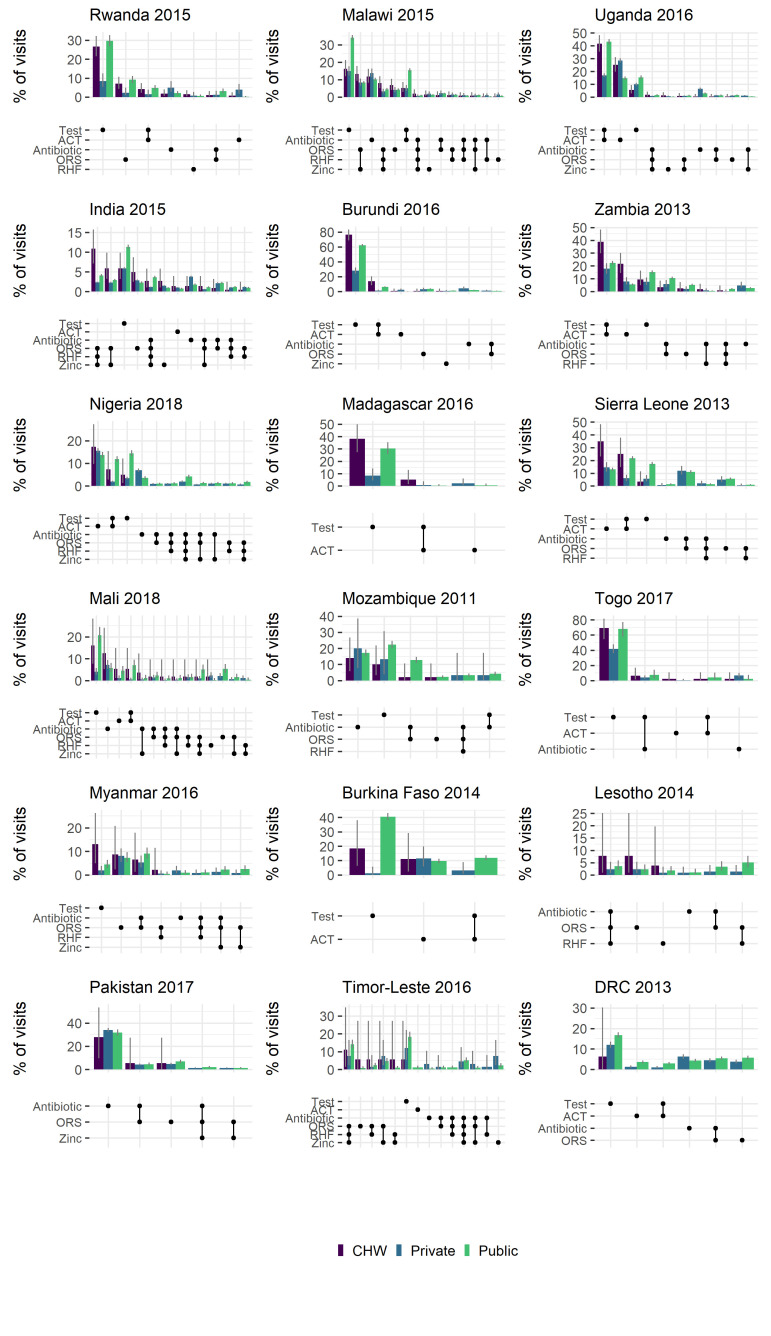
Figure 1.
Percentage of visits resulting in single or combinations of treatments by different health care providers. Bars indicate the proportion of all visits (to a given provider) that resulted in the provision of the diagnostic(s) and/or treatment(s) shown in the lower dot-plot. Bar colours indicate provider, grey lines indicate 95% bootstrapped confidence intervals. Combinations with <1% of share are not plotted. Groupings of treatments are ordered by the % of visits to a community health worker resulting in the combination.

