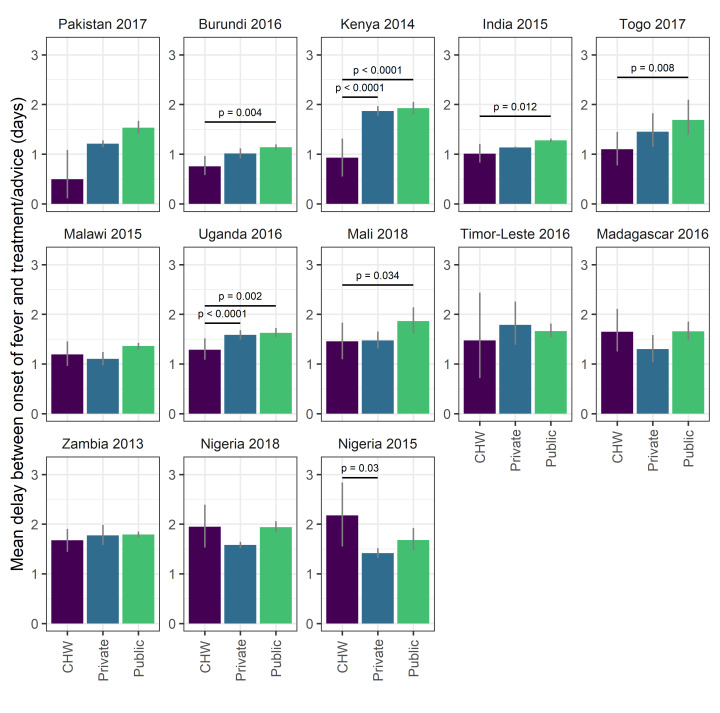
Figure 5.
The average delay before treatment (days after fever began that advice or treatment was sought) by treatment provider group for all surveys. Values are survey-weighted mean estimates with 95% weighted-bootstrapped confidence intervals. Horizontal lines and P-values indicates significantly different mean times between groups as determined by bootstrapped hypothesis test. Surveys are ordered by descending average treatment delays for community health workers.

