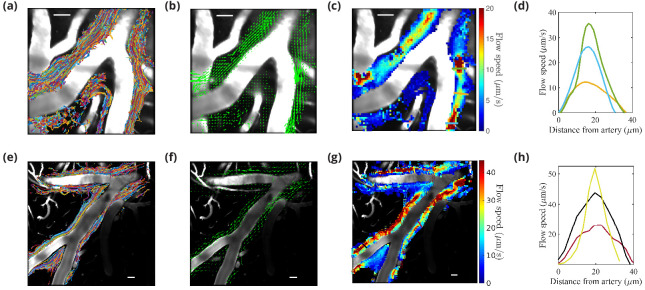
Figure 2. Particle tracking velocimetry in the (PVSs) surrounding cortical branches of the MCA using the single-injection method (panels in first row [Mestre et al., 2018b]) and the new dual-syringe method (second row).
The superimposed particle tracks shown in panels (a) and (e) have similar, continuous spatial distributions and show similar sizes of the perivascular spaces. The time-averaged velocity fields shown in panels (b) and (f) both show net flow of fluid in the same direction as the blood flow. The flow-speed distributions plotted in panels (c) and (g) show comparable speeds, with the fastest flow at the center of the imaged periarterial space and the slowest flow near the boundaries. Panels (d) and (h) show average flow-speed profiles across the corresponding colored lines spanning the PVS in panels (c) and (g), smoothed by interpolation. The parabolic-like nature of these velocity profiles is what is expected for viscous flow in an open channel. Scale bars indicate 50 μm. Figure panels (a, b, c, and d) reproduced from Figure 1, Mestre et al., 2018a, Nature Communications, published under the Creative Commons Attribution 4.0 International Public License (CC BY 4.0; https://creativecommons.org/licenses/by/4.0/).
© 2018, Mestre et al
Figure panels (a), (b), (c), and (d) reproduced from Figure 1, Mestre et al., 2018a, Nature Communications, published under the Creative Commons Attribution 4.0 International Public License.

