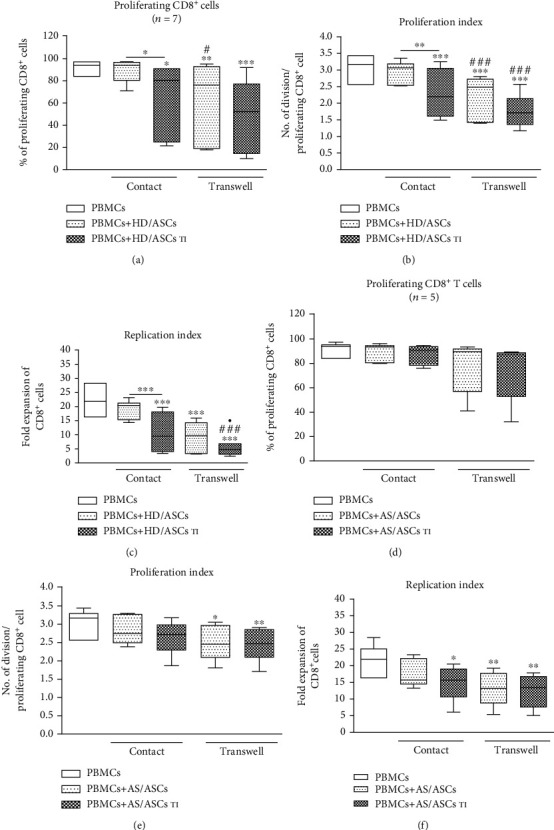
Figure 3.

Comparison of ASC inhibitory effects on CD8+ T cell proliferation in contact and transwell cocultures. Cell origin and culture conditions as in Figure 2, except that CD8+ T cells were analyzed. ∗P = 0.05‐0.01, ∗∗P = 0.01‐0.001, and ∗∗∗P = 0.001‐0.0001 for comparison of cell cocultures vs. control separate cultures and as indicated. #P = 0.05‐0.01 and ###P = 0.001‐0.0001 for comparison of contact vs. transwell cultures.
