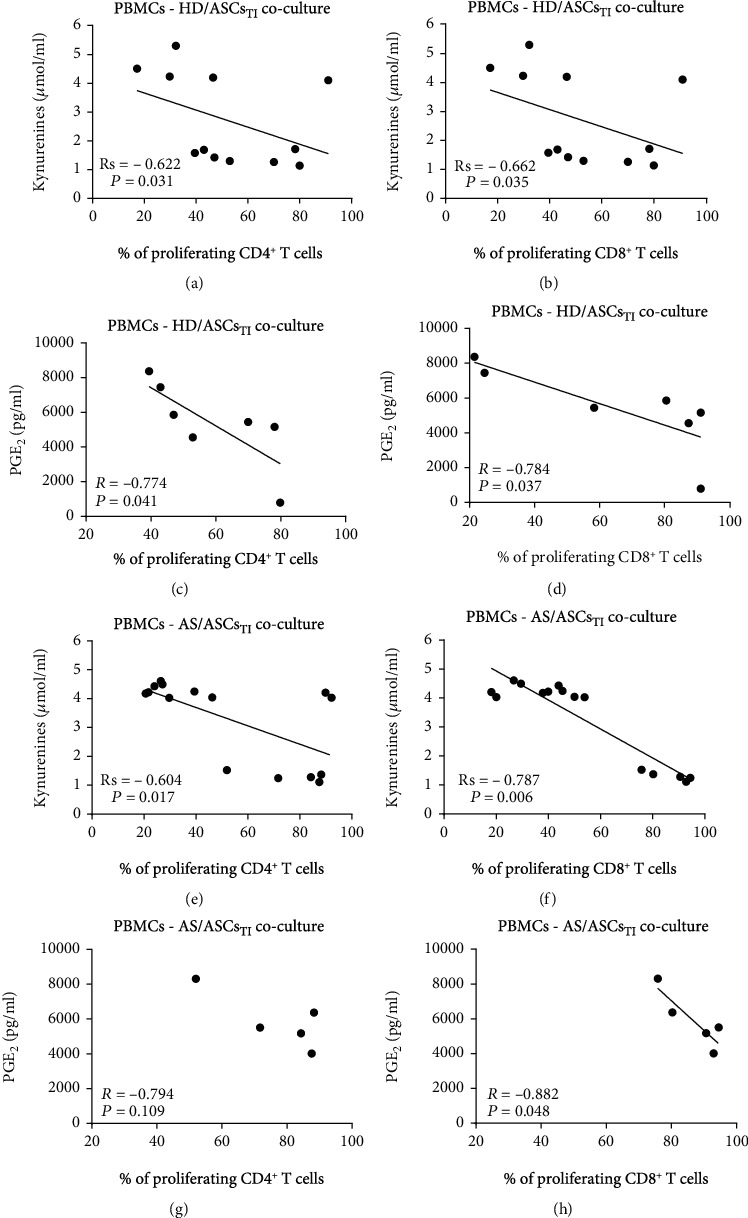
Figure 5.

Correlation of kynurenines and PGE2 concentrations with the number of proliferating T cells. PBMCs stimulated with PHA were cocultured with TNF + IFNγ- (TI-) treated ASCs from HD (a–d) and AS patients (e–h). The proliferation of CD4+ (a, c, e, g) and CD8+ (b, d, f, h) cells was evaluated, and the measurement of kynurenines and PGE2 concentrations was performed as described in Materials and Methods. Spearman's rank (Rs) (a, b, e, f) and Pearson's (R) (c, d, g, h) correlation coefficients and P values are shown. Other explanations as in Figure 1.
