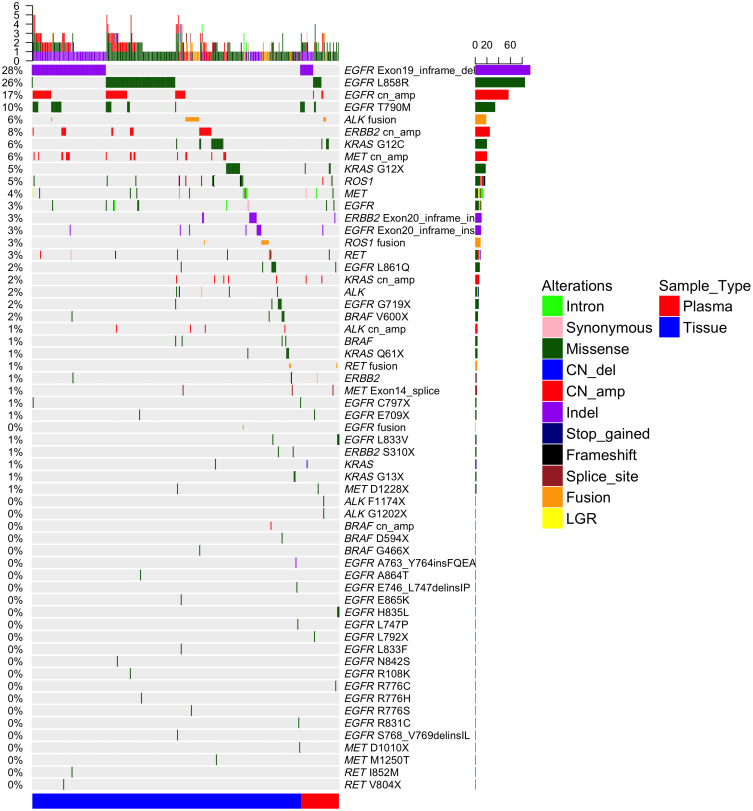
Figure 3.
Driver genetic mutations spectrums identified by next-generation sequencing of 332 patients with NSCLC tumor tissue and plasma. Side bar represents the percentage of patients with driver gene mutation. Top bar represents the number of mutations per patient. Different types of mutations are denoted in different colors.

