Figure 1.

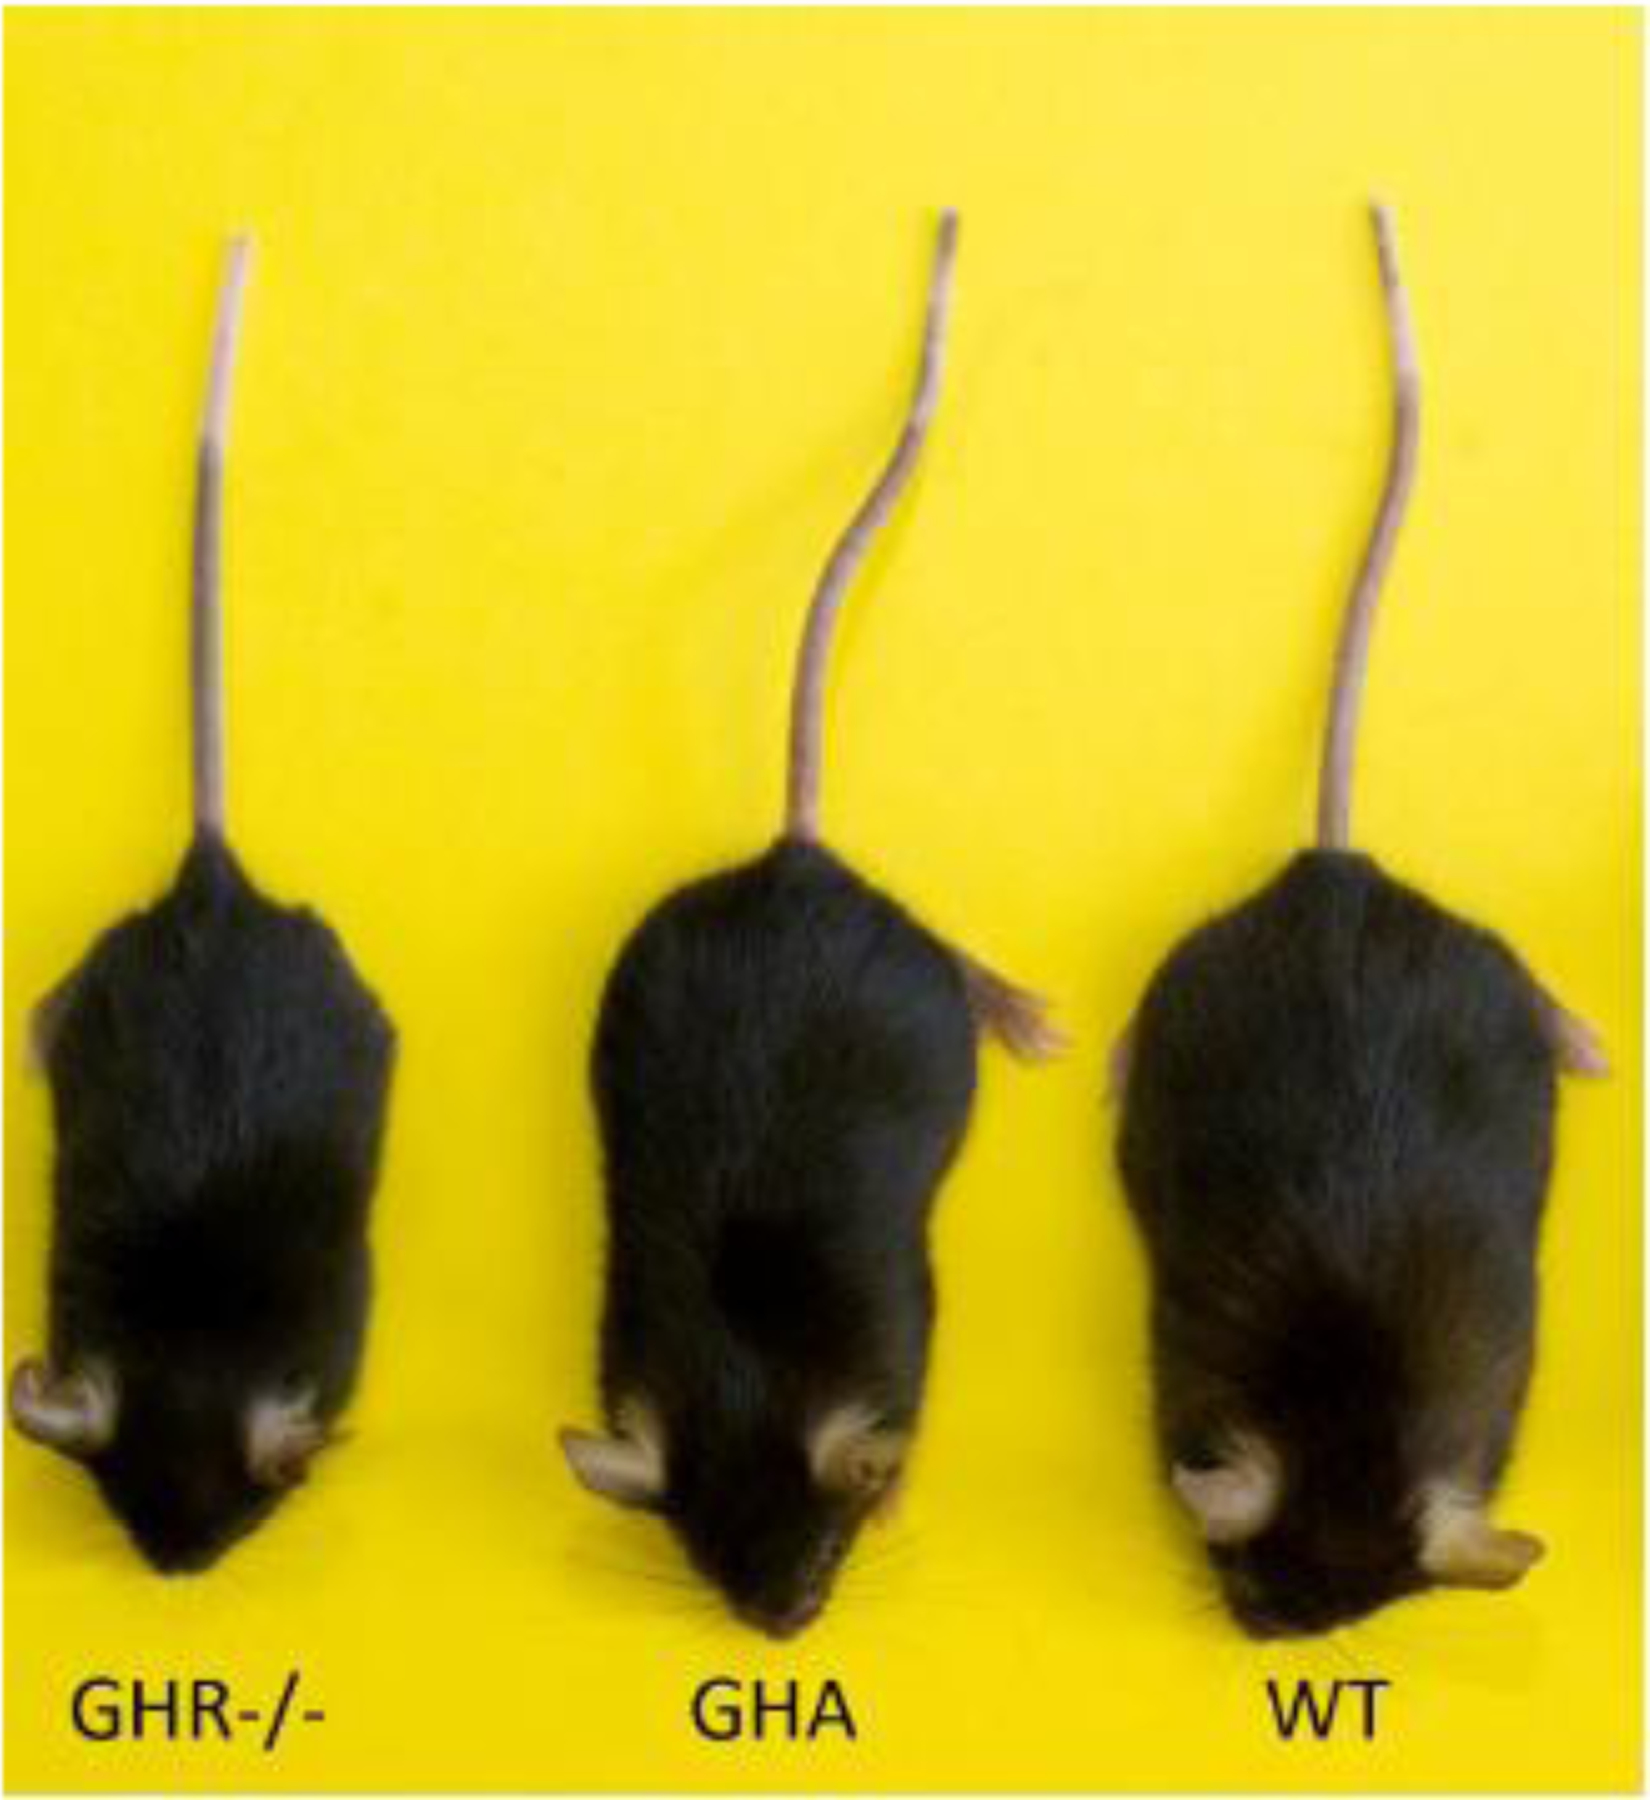
Relative size of mouse models of GHI. This representative sample of GHR−/− mice, GHA mice, and WT controls demonstrates the size change that occurs when a mouse is GH insensitive (GHR−/−) or expresses a GHR antagonist (GHA)

Relative size of mouse models of GHI. This representative sample of GHR−/− mice, GHA mice, and WT controls demonstrates the size change that occurs when a mouse is GH insensitive (GHR−/−) or expresses a GHR antagonist (GHA)