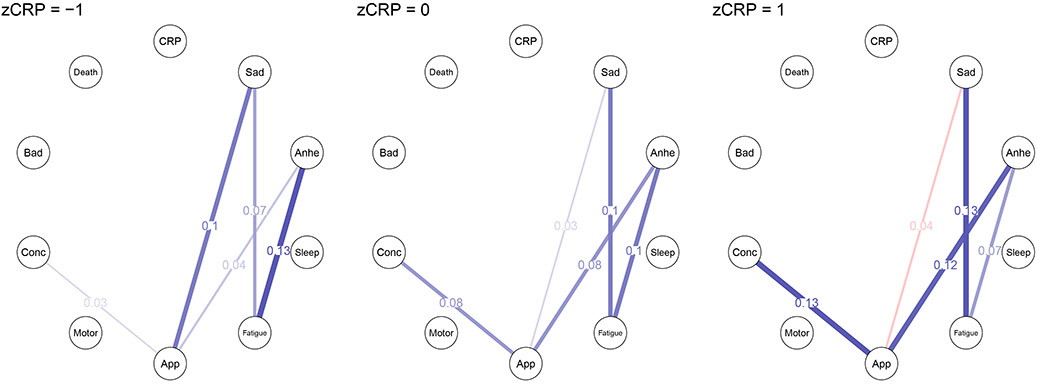
Figure 2. Moderated network models conditioned on z-standardized CRP values of −1 (left), 0 (center), and 1 (right).

Note: Blue edges in the networks depict positive associations, red edges represent negative associations, and thicker/more saturated edges depict stronger associations. Networks include covariates but, for ease of visual interpretation, only CRP and symptoms are visualized. Additionally, only edges moderated by group status are displayed. Abbreviations: zCRP = z-standardized C-reactive protein, CRP = C-reactive protein, Anhe = anhedonia, App = changes in appetite, Conc = difficulty concentrating, Bad = feels bad about oneself.
