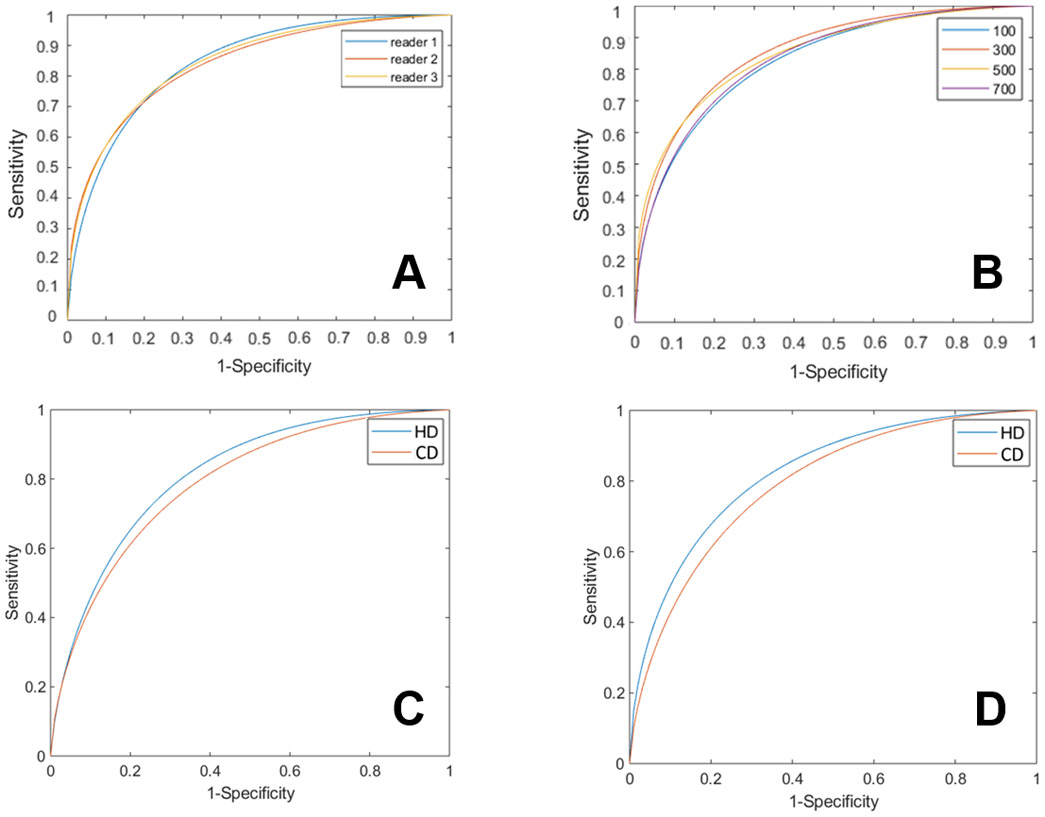
Fig 6.

ROC analysis. A: Individual reader ROC for Agatston cut point of 300 for calcification (+). Individual readers’ curves with AUCs for readers 1-3, 0.83, 0.81, and 0.82, respectively. Average ROC curve of three readers were obtained by averaging the parameters of the bi-normal ROC model as suggested by Metz et al.[15] and used subsequent panels. B: Average ROCs of three readers as a function of the Agatston cut point for calcification (+). Cut-points are Agatston 100, 300, 500, and 700, as shown (see text for analysis method). Conventional and high exposure cases, and LVR and AVR territories are combined to get better statistics. Average AUCs are 0.78 (CI: 0.72-0.83), 0.85 (CI: 0.74-0.86), 0.83 (CI: 0.7-0.84) and 0.82 (CI: 0.71-0.83), respectively. C: Average ROC curve of three readers at LVR, high and low dose acquisitions gave AUCs of 0.85 (CI: 0.79-0.88) and 0.82 (CI: 0.78-0.86), respectively. D: Average ROC curve of three readers at AVR, high and low dose acquisitions gave AUCs of 0.86 (CI: 0.78-0.88) and 0.82 (CI: 0.76-0.84), respectively.
