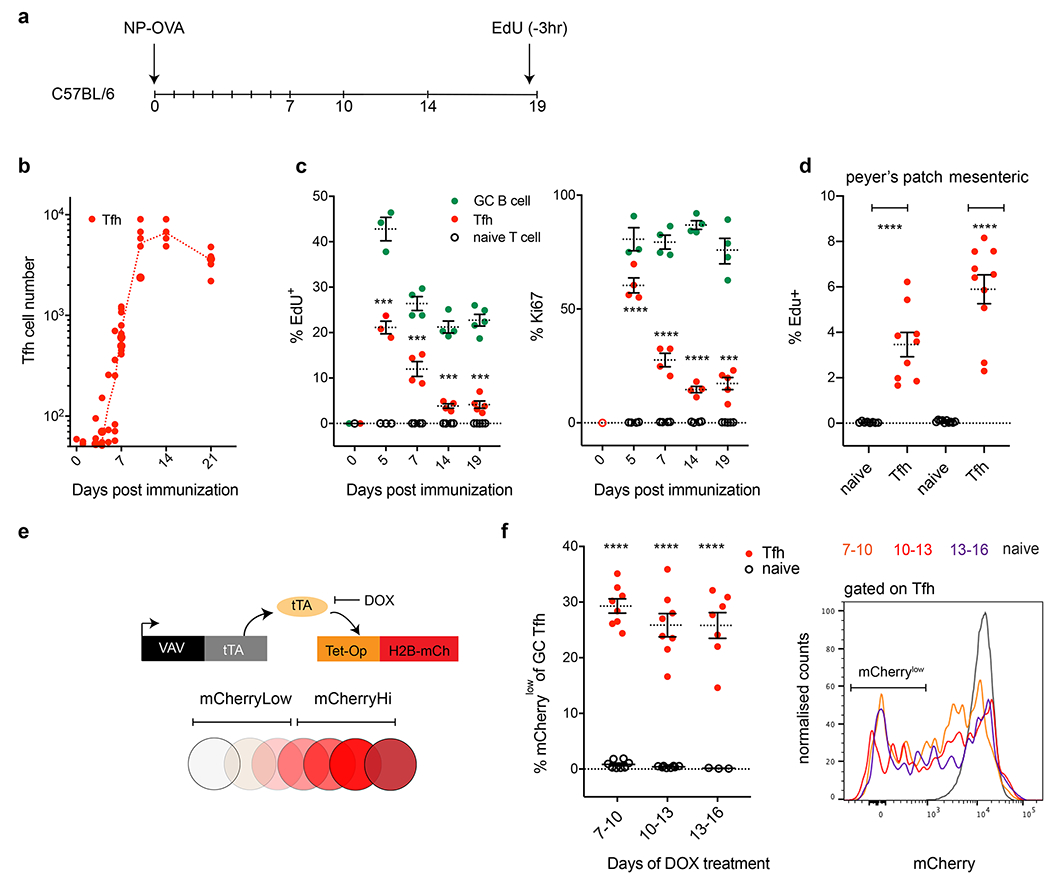
Figure 1. Tfh cells continue to divide during the GC reaction.

a, Schematic representation of the experimental setup. b, Kinetics of Tfh development in C57BL/6 mice following NP-OVA immunization. Y axis depicts the absolute numbers of Tfh (red) in popliteal lymph nodes, X axis days post immunization (dpi). Data are from 3-5 mice per time point, each dot represents one mouse. Gating strategies are detailed in Extended data Fig. 1. c, Plots show percentage of EdU or Ki67 positive cells, Y axis, GC B cells (green), Tfh (red) and naïve T cells (black). X axis is dpi. Data are from 3-5 mice per time point and each dot represents one mouse. EdU was delivered 3 hours before mice were culled. ***, and **** p=0.001 or p<0.0001 by unpaired Student’s t-test (two-tailed) when comparing Tfh and naïve T cells. f, Plot shows percentage of EdU, Y axis, Tfh (red) and naïve T cells (black) from peyer’s patch (left) or mesenteric lymph nodes (right). Data are from 9 mice per group and each dot represents one mouse . p<0.0001 by unpaired Student’s t-test (two-tailed) when comparing Tfh and naïve T cells. e, Diagrammatic representation of the Vav-tTA and Tet-Op-H2B-mCh transgenes that were combined (tTA-H2B-mCh mice) to measure cell division in the GC. f, Plots show frequency of naïve or Tfh T cells that became mCherrylow when treated with doxycycline (DOX) between days 7-10 (8 mice per group), 10-13 (8 mice per group) or 13-16 (7 mice per group) after immunization with NP-OVA. Rightmost panel; histogram overlays comparing relative H2B-mCh fluorescence among Tfh T cells during the three time windows of exposure to DOX or in naïve T cells. **** p<0.0001, by unpaired Student’s t-test (two-tailed) comparing Tfh and naïve T cells. All experiments were done a minimum of two times and error bars always plot standard error of the mean (SEM).
