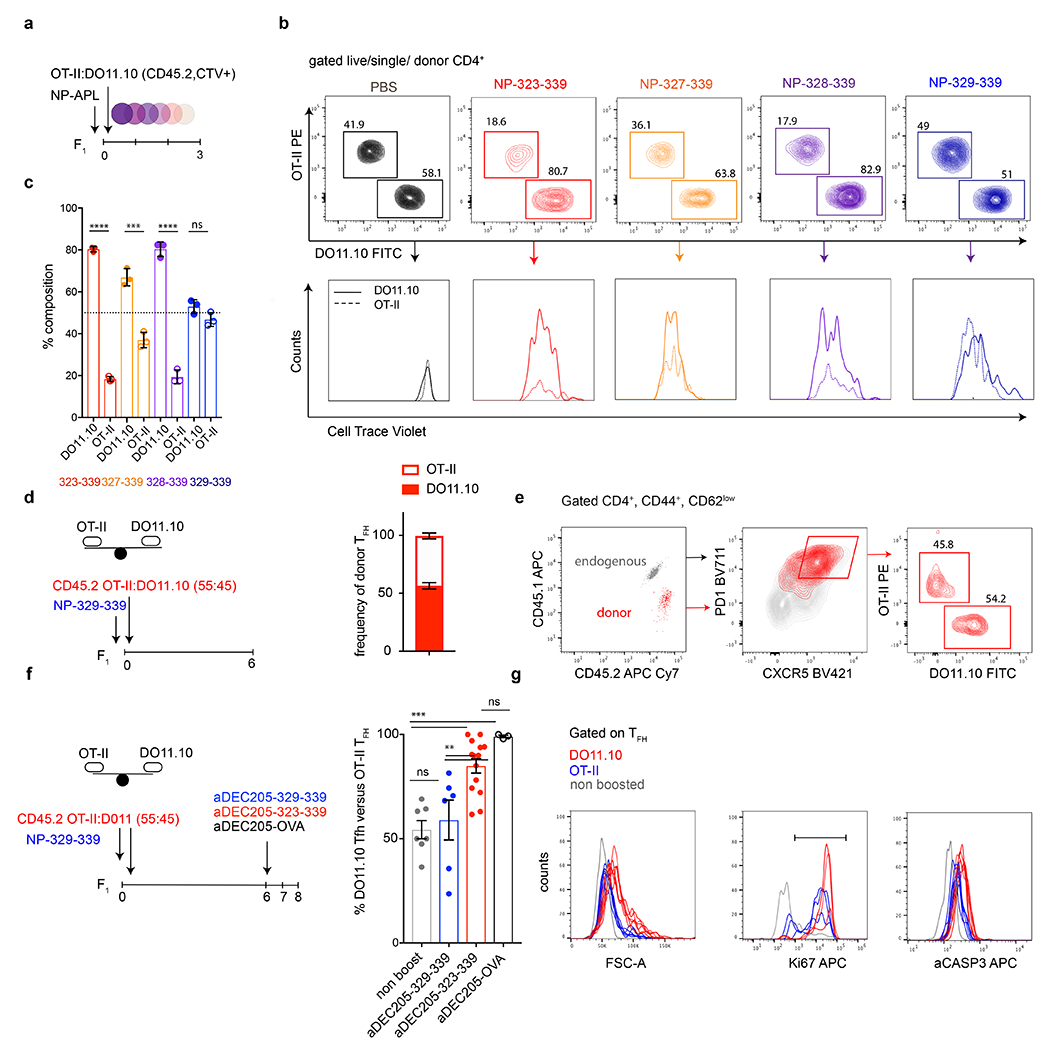
Extended Data Fig. 6. DO11 and OTII have different affinities for APLs.

a, Schematic depicts the experimental setup. CTV labelled DO11.10 and OTII T cells were adoptively transferred into F1 mice and subsequently immunized with the NP-APLs. b, Representative flow cytometry plots compare the relative distribution and CellTrace Violet dilution of DO11.10 and OTII T cells in adoptive transfer recipients 3 dpi. Each panel of plots represents an individual mouse from the group. c, Bar graph shows the aggregate relative contribution of DO11.10 and OTII T cells 3 days after immunization in 3 mice per condition. Dotted line depicts the input ratio of DO11.10 and OTII at the time of transfer.***,**** p=0.0007, <0.0001 by unpaired Student’s t-test. This experiment was done twice but data for one experiment is plotted. d, Schematic depicting experiment in which adoptive transfer recipients of DO11.10 and OTII T cells were immunized with NP-329-339. Adjacent bar graph shows the aggregate relative contribution of DO11.10 and OTII T cells 6/7 days after immunization with NP-329-339. e, Representative flow cytometry plots showing the distribution of DO11.10 and OTII T cells in the Tfh compartment 7 days after immunization. f, Schematic depicting experiment in which adoptive transfer recipients of DO11.10 and OTII T cells were immunized with different NP-329-339 and boosted with the respective αDEC205 chimeric antibodies. Bar graph compares changes in the frequency of DO11.10 versus OTII Tfh when boosted with different αDEC205 chimeric antibodies on 6 dpi. Each dot represents an individual mouse and group size varied from 3-13 mice per condition. **,*** p=0.9, p<0.01, p<0.001 by one-way ANOVA test. g, Histogram overlays compare cell size (FSC-A), Ki67 expression and aCasp3 expression in OTII and DO11.10 Tfh populations from individual mice 18 hours following αDEC205-323-339 boosting. These experiments were repeated 2-3 times.
