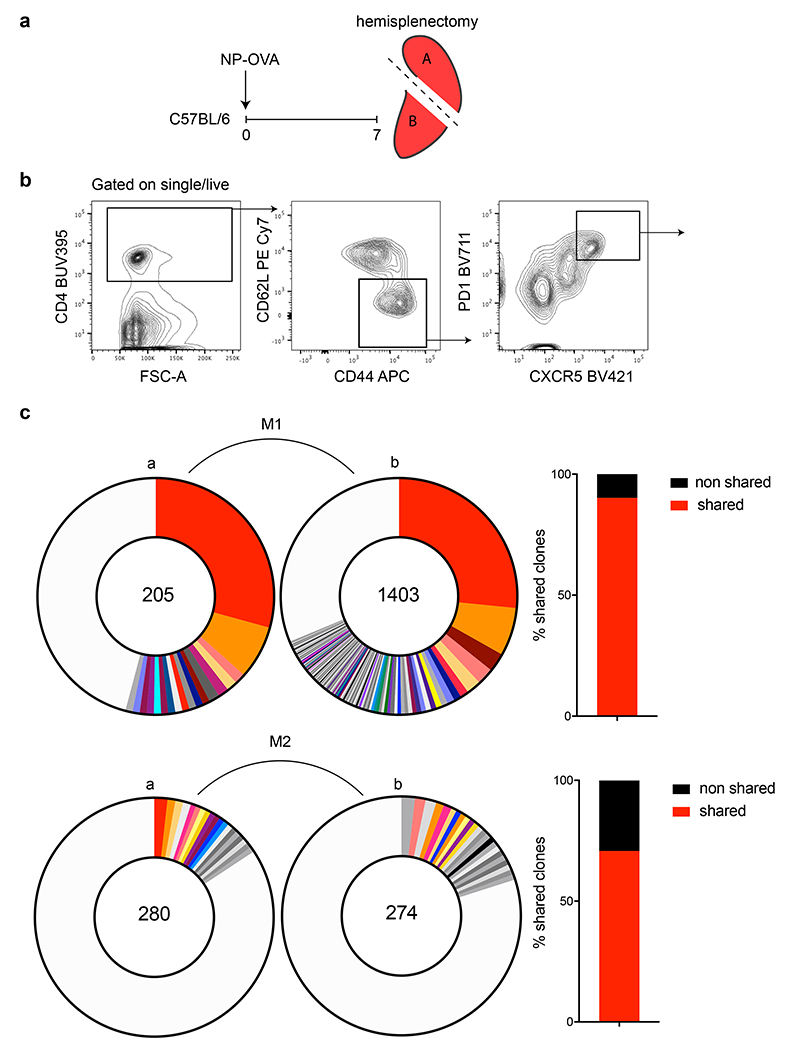
Extended Data Fig. 8. Conservation of Tfh clonal families and clonal dominance in the spleens of d7 immunized mice.

a, Schematic representation of the experimental strategy used in b, c. b, Flow cytometric plots depict the gating strategy used to define Tfh populations in c. Briefly, wt mice were immunized with NP-OVA and 7 days later Tfh cells were purified from the 2 halves of the spleen and then sequenced. c, Pie charts show expanded clonal families in each half of the spleen. Slices are proportional to the number of clones within a family. Colors indicate shared clones between the 2 spleen halves, a and b, from an individual mouse. Grey tones indicate unique clones not shared between the 2 halves. The total number of paired TCR chains recovered is indicated by the number in the center of the pie charts. Clonal distribution between adjacent spleen halved in M1 (top) is ns (p=0.2279) and M2 (bottom, p=0.009) by Fisher’s Exact test. Adjacent bar graphs show the relative conservation of clonotypes between the 2 halves of the spleen. Here, shared is that a clone can be found in both segments of the spleen and non-shared here is referring to anatomically novel clones.
