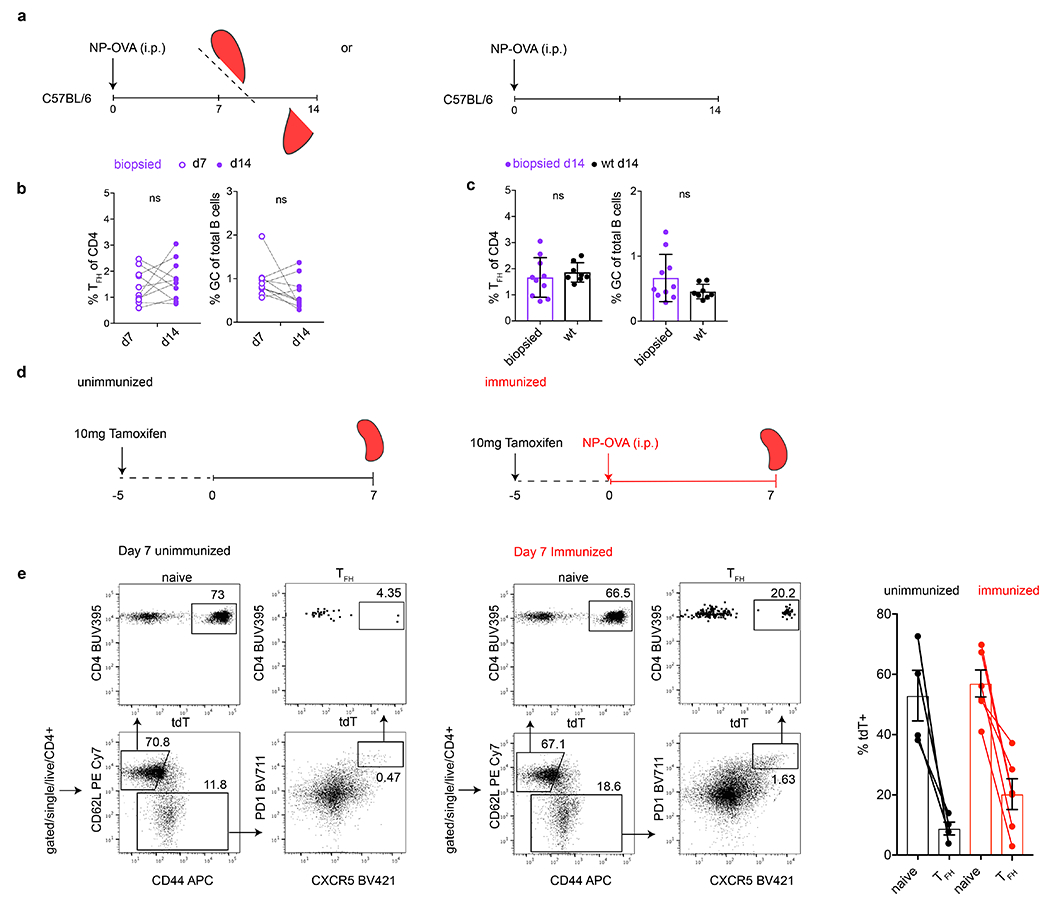
Extended Data Fig. 9. Hemi-splenectomized mice have normal GC reactions.

a, Schematic representation of the experimental strategy used in b, c. Briefly, NP-OVA immunized C57BL/6 mice were biopsied on 7 dpi and culled on 14 dpi in order to interrogate changes that might occur in the GC compartment following surgical intervention (left). NP-OVA immunized C57BL/6 mice who did not receive surgical intervention served as controls for biopsied mice (right). b, Adjacent plots show the frequency of Tfh within total CD4+ T cells (left) or GC B cells within total B cells (right) in individual biopsied mice between time points 7 dpi (open purple) and 14 dpi (closed purple). Data was tested by paired Student’s t-test (p=0.43 and p=0.14) and so revealed no significant differences between the time points. Dotted lines trace individual mice over time. c, Adjacent plots compare the frequency of Tfh within total CD4 T cells (left) or GC B cells within total B cells (right) on 14 dpi in mice who were either biopsied (purple) or C57BL/6 mice who were not (black). Student’s t-test p=0.52, p=0.13 revealed no significant differences between the experimental groups. d, Schematic representation of the experimental strategy used in e. e, Flow cytometry plots profiling of tdT expression in splenic naïve and Tfh compartments in tamoxifen treated mice but unimmunized mice (left quadrants) or similarly in tamoxifen treated mice 7 days after NP-OVA immunization (right quadrants). Rightmost bar graph compares the percentage of tdT+ populations between labeled populations in the unimmunized and immunized mice (13 days after tamoxifen administration and 7 dpi).
