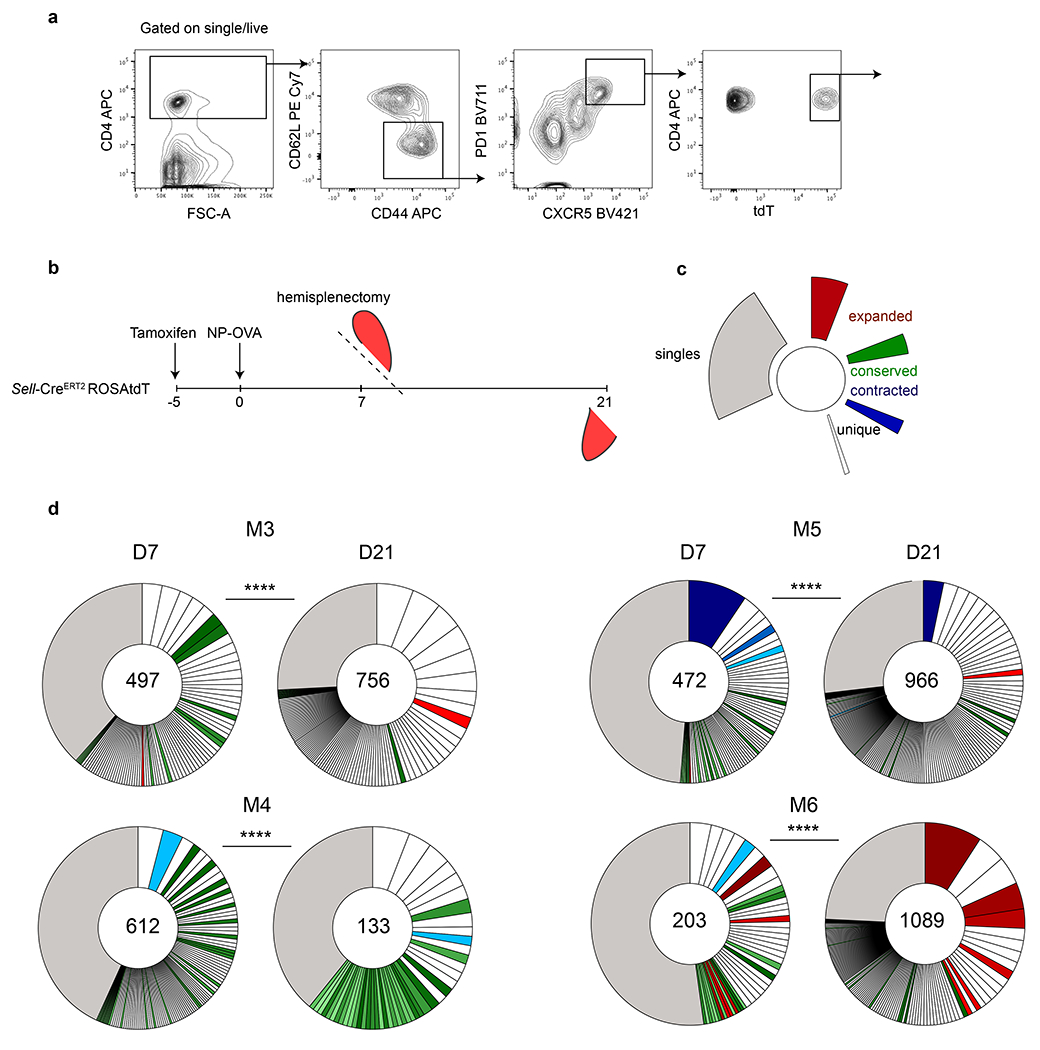
Extended Data Fig. 10. scRNA-seq reveals extensive clonal evolution of Tfh.

a, Flow cytometry plots depicting gating strategy used to define responding Tfh cells. b, Schematic representation of the experimental strategy used in d. c, Color coded indexing for the clonal behaviors categorized in mice between d7 and d21. Expanded (red), conserved (green), contracted (blue) and singles (grey). Clones that are not colored were novel to each time point. d, Pie charts show clonal populations of Tfh within each mouse at each time point. Segments within the pie charts report the proportional representation of each clone. Clonotypes containing the same CDR3 sequence for alpha or/and beta chain. **** by Fisher Exact test, p= 0.000016 reveals that clonal composition is significantly different between time points within the same mouse. Numbers inside the pie charts refer to the total number of alpha and beta TCR sequences recovered.
