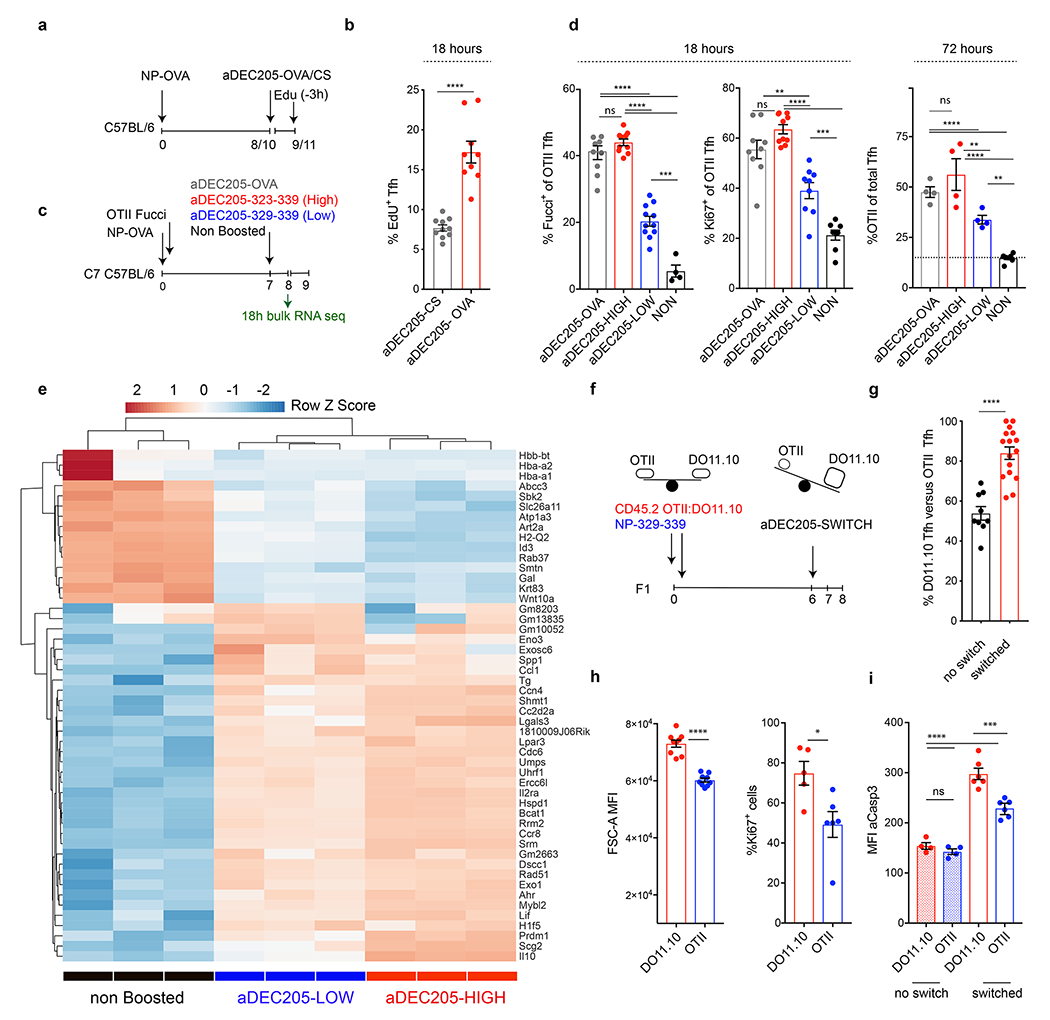
Figure 2. Tfh proliferate proportionately to TCR signaling.

a, Schematic representation of experimental setup used in b. b, Bar graph shows the percentage of proliferating Tfh cells as defined by EdU incorporation following aDEC205-CS (10 mice) or aDEC205-OVA (9 mice) treatment. Each dot represents an individual mouse. p<0.0001 by unpaired Student’s t-test (two-tailed). c, Schematic representation of experimental setup used in d, e. d, Plots showing the percentage of OTII Tfh cells that express Fucci (10, 10, 10 and 4 mice per group from left to right) or Ki67 (9, 10, 9 and 8 mice per group from left to right) 18 hours after αDEC205-chimeric antibody injection. Each dot represents an individual mouse. **,***,**** p= 0.0012, p=0.0007 and p<0.0001 by one-way ANOVA test. Rightmost plot shows percentage of OTII T cells among Tfh cells 72 hours after αDEC205-chimeric antibody injection. Data are from 4 mice per group and each dot represents one mouse. ** ,**** p=0.005 or p=0.0068 and p<0.0001, by one-way ANOVA test. e, Heat-map of hierarchically-clustered purified populations of OTII Tfh T cells. Comparing gene expression of the 50 most differentially expressed genes. *, ***, and **** p=0.0160 or p=0.0211, <0.001, and <0.0001, by one-way ANOVA test. f, Schematic depicting experimental setup for the competition experiment between DO11.10 and OTII Tfh cells in g. g, Bar graphs compare changes in the frequency of DO11.10 versus OTII Tfh in αDEC-323-339 boosted (switched) or un-injected controls. Data are from 10 or 16 mice per group and each dot represents one mouse. p=0.0001 by unpaired Student’s t-test (two-tailed). h, Bar graphs compare the size of blasting cells (left, 8 mice per group) or the percentage of Ki67 positive cells (right, 6 or 7 mice per group) in DO11.10 or OTII Tfh populations 18 hours after αDEC205-chimeric antibody exposure. Each dot represents one mouse. *,**** p=0.0183 and p<0.0001 by unpaired Student’s t-test. j, Bar graph compares the aCasp3 expression between non-boosted populations and in the same populations 18 hours following αDEC205-boosting. ***, and **** p=0.0001, and p<0.0001 by one way ANOVA test. Each experiment was done 2-3 times and error bars plot ±SEM .
