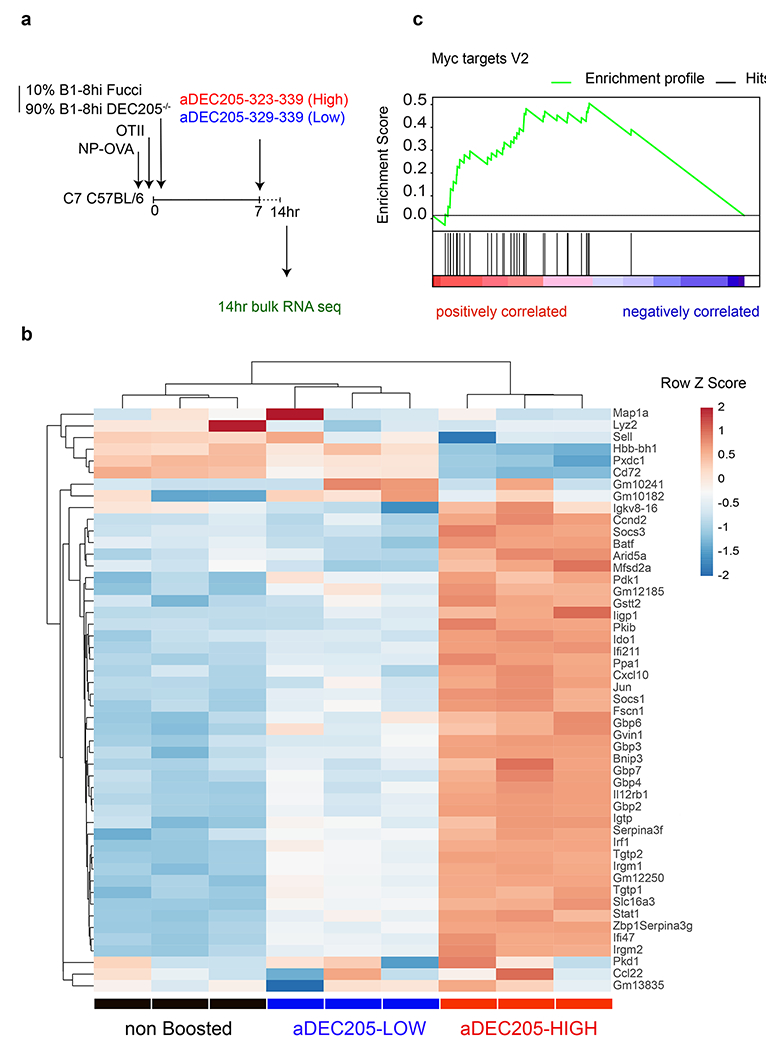
Figure 3. TCR signaling dictates the quality of T cell help delivered.

a, Schematic representation of experimental setup used in b. The Flow cytometric plots showing the gating strategy to isolate positively selected light zone germinal center B cells 14 hours after αDEC205-APL antibody injection is detailed in Extended data 8. b, Heat-map of hierarchically-clustered purified populations of Fucci+ LZ B cells. Comparing gene expression of the 50 most differentially expressed genes. c, Plot is a graphical representation of GSEA and the rank-ordered gene lists found upregulated in αDEC205-HIGH versus αDEC205-LOW boosted in recently selected Fucci+ GC LZ B cells. Nominal p-value p=0.0. Enrichment Score (ES)=0.4911. Normalized ES= 2.64. FDR q-value=0.0.
