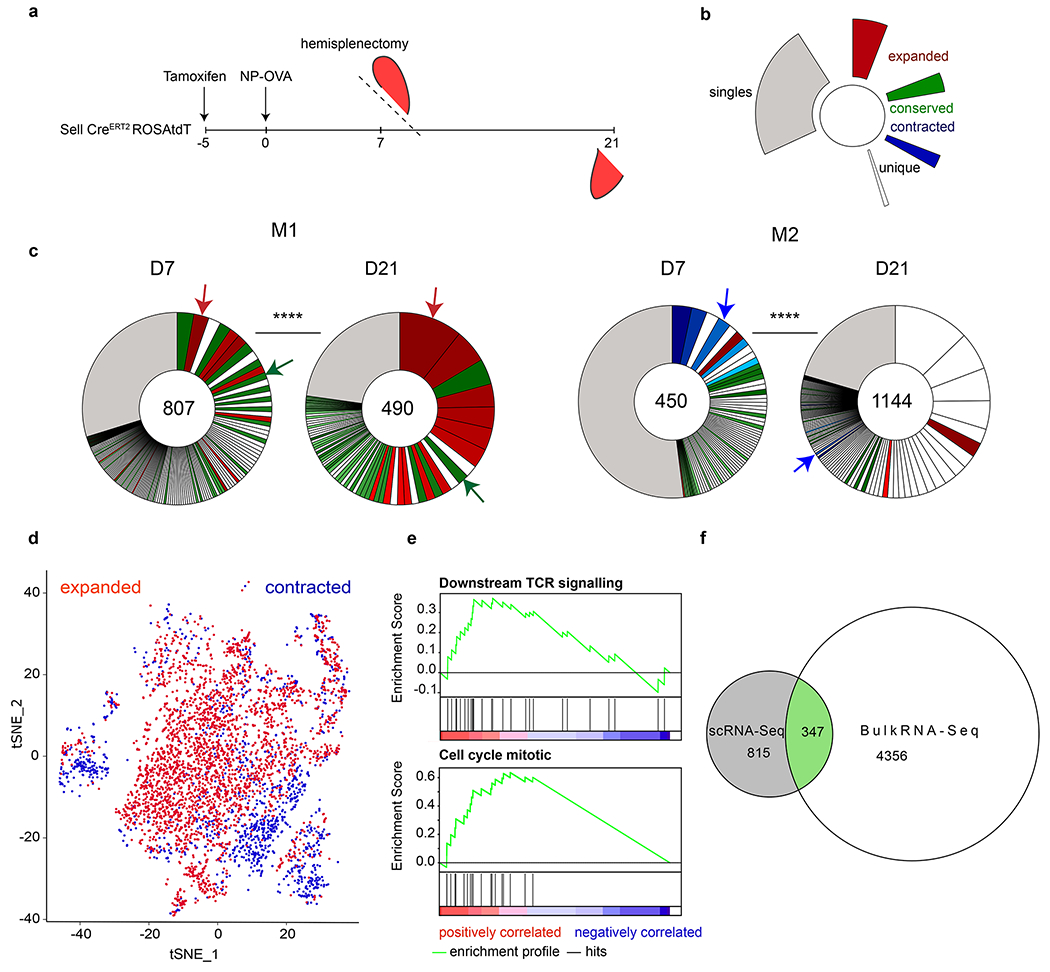
Figure 4. Extensive Tfh clonal evolution.

a, Schematic representation of experimental setup. b, Color coded indexing for the clonal behaviors between d7 and d21. Expanded (red), conserved (green), contracted (blue), singles (grey). Clones that appear white were novel to each time point, either contracting or expanding between the time points. c, Pie charts show clonal populations of Tfh within each mouse at each time point. Segments within the pie charts report the proportional representation of each clone. Clonotypes containing the same CDR3 sequence (nt) for alpha or/and beta chain. **** Fisher Exact test (p=0.000016). Red, green and blue arrows denote examples of clones found between time point that either expanded, contracted or were relatively conserved, respectively. Numbers inside the pie charts refer to the total number of TCR sequences. d, t-SNE plot calculated using 20 PCA dimensions on scRNA-Seq data, comparing transcriptome of all expanded clones versus all contracted clones (pooled between all mice). e, GSEA of differentially expressed genes between clones that expanded or contracted. Downstream TCR signaling: nominal p-value p=0.0029 Enrichment Score (ES)=0.37. Normalized ES= 1.84. FDR q-value=0.036. Regulation of Mitotic Cell cycle: nominal p-value p=0.00 Enrichment Score (ES)=0.63. Normalized ES= 2.71. FDR q-value=0.00.f, Euler Diagram comparing the number of shared genes between the scRNA-Seq (grey) and OTII bulk RNA-Seq (white) that have the same behavior, either up or down-regulated (green).
