
Extended Data Fig. 1. Tfh gating strategy.
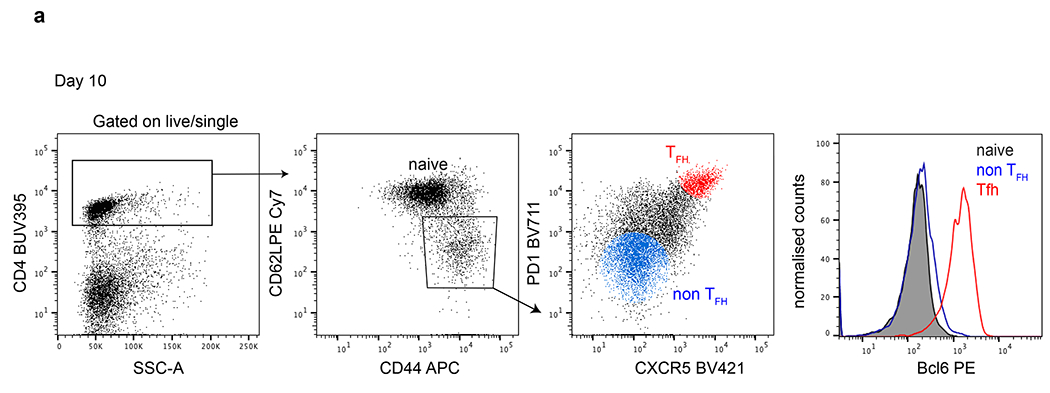
a, Flow cytometry plots detailing the Tfh gating strategy. Rightmost histogram compares Bcl6 expression in naïve (grey) and non Tfh (blue) versus Tfh (red) populations on d10 post immunization.
Official websites use .gov
A
.gov website belongs to an official
government organization in the United States.
Secure .gov websites use HTTPS
A lock (
) or https:// means you've safely
connected to the .gov website. Share sensitive
information only on official, secure websites.
a, Flow cytometry plots detailing the Tfh gating strategy. Rightmost histogram compares Bcl6 expression in naïve (grey) and non Tfh (blue) versus Tfh (red) populations on d10 post immunization.