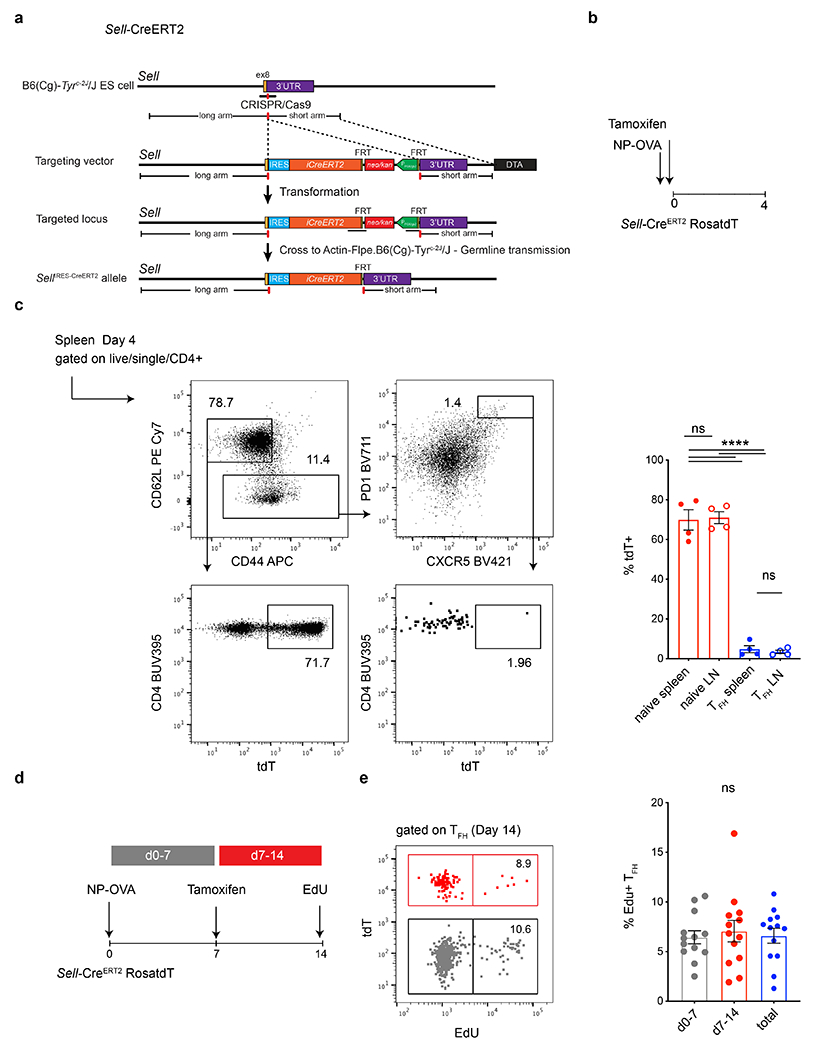
Extended Data Fig. 2. Production of SellCreERT2 ROSAtdT indicator mice.

a, Targeting strategy and the configuration of the SellIRES-CreERT2 allele. The mice were produced at Rockefeller University and crossed to ROSA tdTomatoloxP/loxP to generate SellCreERT2 ROSAtdT indicator mice. b, Schematic representation of the experimental strategy used in c. c, Flow cytometry plots profiling tdT expression in naïve and Tfh splenic compartments in tamoxifen treated, mice culled 4 dpi. Rightmost plots compare the percentage of tdT labelling in naïve T cells (red) or Tfh cells (blue) residing in spleens (closed circle) or lymph nodes (open circle) of mice following the regime outlined in b. Data are from 4-5 mice per group and each dot represents one mouse .**** p <0.0001 by one-way ANOVA test. The experiment was performed 2 times. d, Schematic representation of the experimental setup. e, Flow cytometry plot showing EdU incorporation in labelled (red) or unlabeled (grey) Tfh populations on 14 dpi. Rightmost plot shows the frequency of EdU positive Tfh T cells 14 dpi, in population generated in the first 7 days (grey) or between days 8-14 (red) or the cumulative (blue). Flow cytometry plot showing EdU incorporation in labelled (red) or unlabeled (grey) Tfh populations on 14 dpi. EdU was delivered 3 hours before mice were culled. Numbers inside the gates denote the relative representation of EdU positive cells from within tdT positive or negative populations. Each dot represents one mouse. Data are from 14 mice and the experiment was performed twice.
