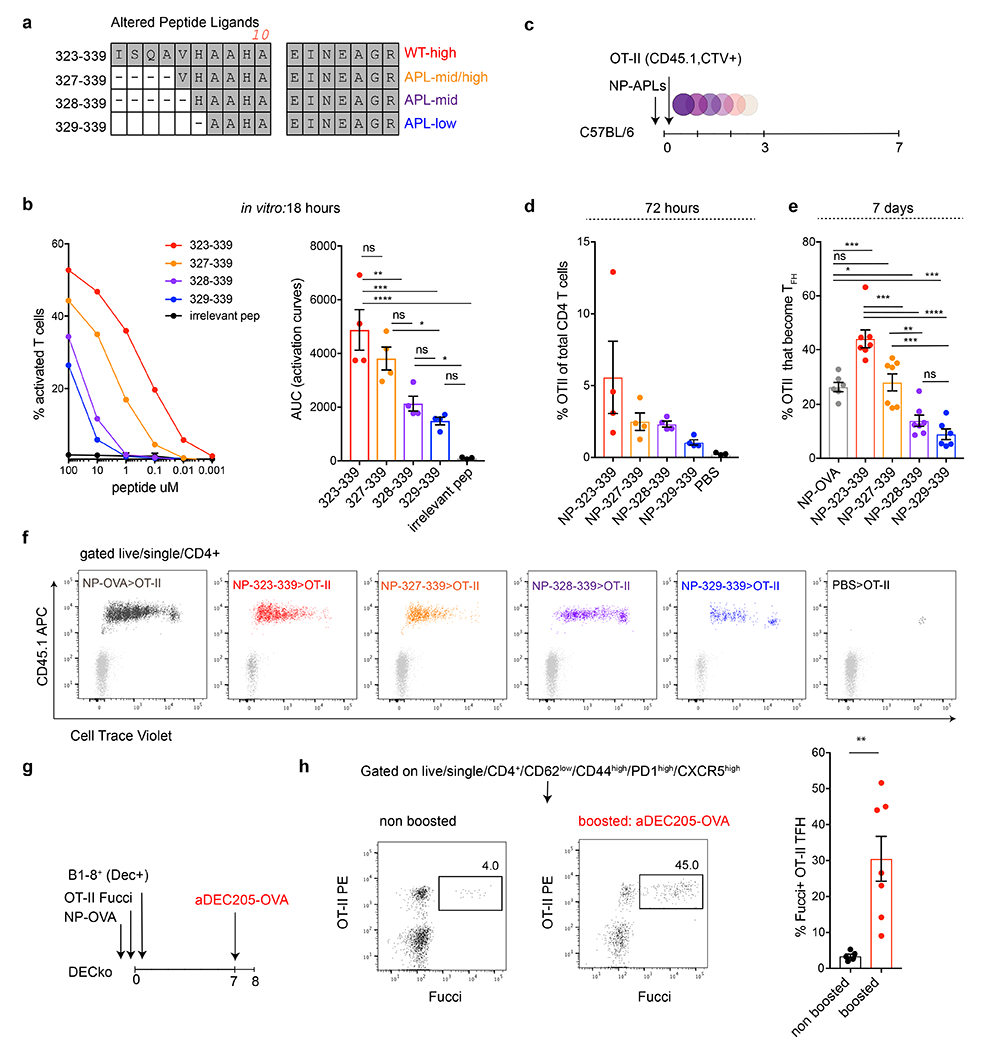
Extended Data Fig. 3. OTII have disparate abilities to recognize the truncated APLs.

a, Description and sequence alignment of the nested altered peptide ligands (APLs). b, Graph shows OTII T cell responses to decreasing concentrations of APLs in vitro as measured by CD69 upregulation following 18 hours of exposure. Y axis shows the percentage of activated T cells and X axis is the peptide concentration. Bar graph shows the area under the adjacent response curves (AUC). *, ***, and **** p=0.0130, =0.0001, and <0.0001 tested by one-way ANOVA test. Each dot represents a distinct experimental well. This experiment was repeated 4 times. c, Schematic representation of experimental setup used in d-f. d, Bar graph shows percentage of OTII among all CD4 T cells in adoptive transfer recipients 72 hours after immunization with the indicated NP-APLs. e, Bar graph shows percentage of OTII T cells that become Tfh 7 days after NP-APL immunization. *, **, ***, and **** p=0.0186, =0.0039, <0.001 and <0.0001, by one-way ANOVA test. Each dot represents one mouse, with 6 or 7 mice per group and repeated a total of 2 times. f, Flow cytometry plots showing dilution of CellTrace Violet by OTII T cells responding to the NP-APL immunization in vivo after 72 hours. Each plots is an individual mouse. g, Schematic representation of experimental setup used in h. h, Flow cytometry plots profiling Fucci expression in non-boosted (5 mice) control or 18 hours following αDEC205-OVA (7 mice) injection. Rightmost bar graph compares the percentage of Fucci+ OTII Tfh in the respective conditions. Each dot represents a mouse and this experiment was performed twice. ** p=0.0048 by unpaired Student’s t-test.
