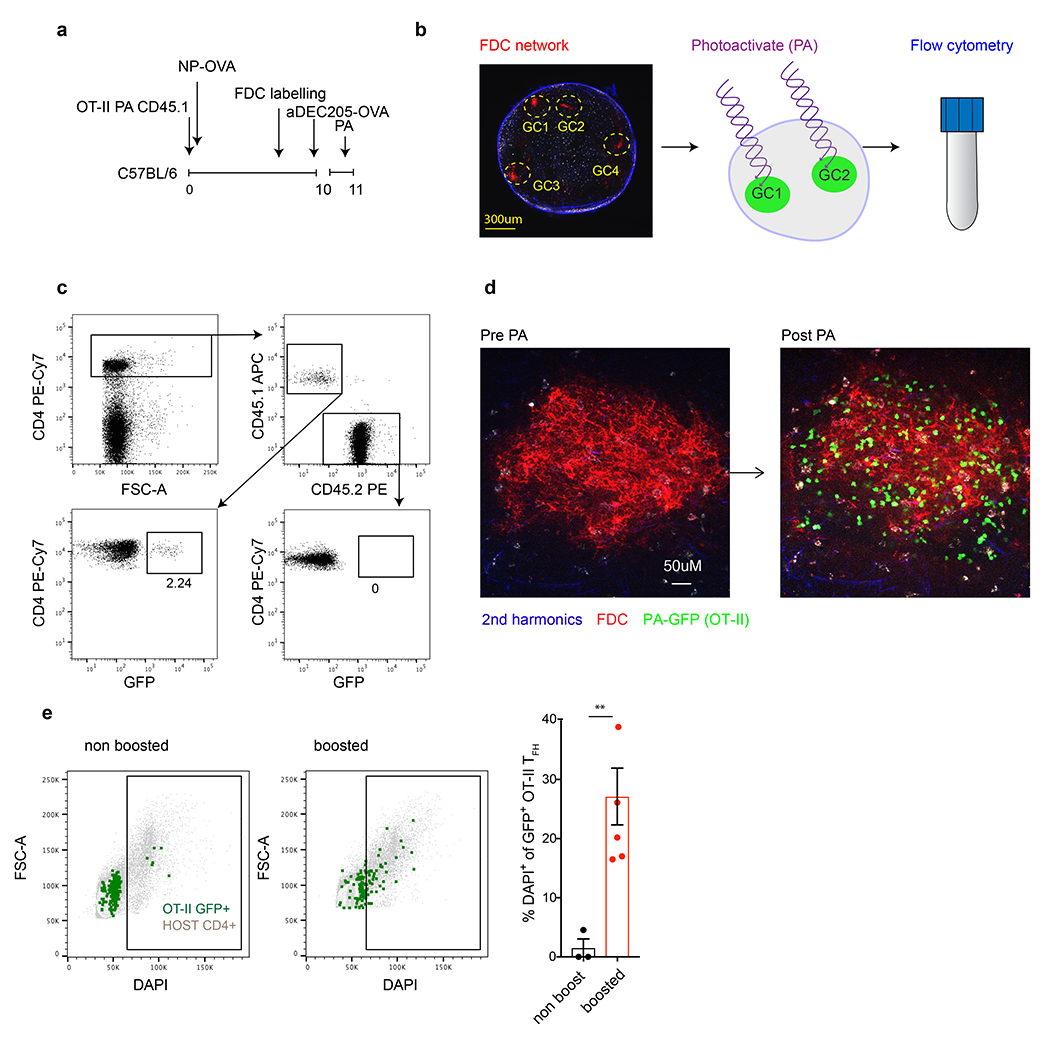
Extended Data Fig. 4. GC resident Tfh proliferate.

a, Schematic representation of experimental set up used in b-e. b, GCs in popliteal lymph nodes, as defined by the fluorescently labelled FDC network (red), were photoactivated (green) 18 hours after αDEC205-OVA injection, stained with a cocktail of fluorescent antibodies to allow analysis by downstream flowcytometry. c, Representative flow cytometry plots showing the gating of photoactivated OTII Tfh cells. d, A single GC from a popliteal lymph nodes as defined by fluorescently labelled FDC networks (red) pre and post photoactivation (left to right, respectively). OTII GC resident Tfh were photoactivated (green) 18 hours after αDEC205-OVA injection. e, Representative flow cytometry plots comparing DAPI staining in host (grey) or OTII GC resident GFP+ cells (green) in unperturbed mice (left) or 18 hours after boosting with an αDEC205-OVA injection (right). Bar graph shows the percentage of photoactivated OTII Tfh that entered the cell cycle (DAPI+) following αDEC205-OVA injection (5 mice) or in un-injected controls (4 mice). Each dot represents pooled lymph nodes from a single mouse.**, p=0.0086 by unpaired Student’s t-test. This experiment was repeated 2 times.
