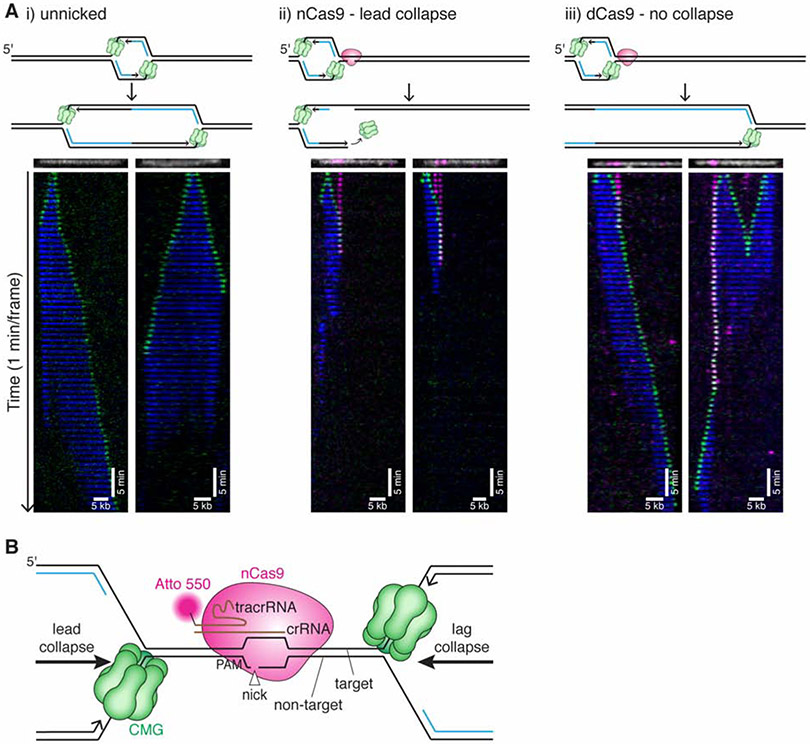
Figure 2. CMG is lost at the nick after lead collapse.
(A) Tethered DNA was untreated (i), nicked with nCas9Atto550 (ii), or incubated with dCas9 Atto550 (iii) and replicated in extract containing Fen1mKikGR and GINSAF647. Representative kymographs are shown for each condition. For nCas9 (ii), we show kymographs where CMG approaches nCas9 from the short arm for lead collapse (in the left kymograph, the left nCas9 appears to dissociate before CMG arrival). CMG is shown in green, Fen1mKikGR in blue, nCas9 in magenta. Although more than one Cas9 is frequently bound, only one is depicted in cartoons. Kymographs were created by stacking the frames of a movie (one-minute intervals). The DNA (white) and nCas9 (magenta) shown above each kymograph are from imaging the nCas9 and DNA before extract addition. Kymographs are generated from representative molecules from two biological replicates of each experiment. See also Supplemental Figure S2 and Supplemental Videos 1-3. (B) Schematic of nCas9 H840A bound to DNA with replication forks arriving from the left (lead collapse) or right (lag collapse).

