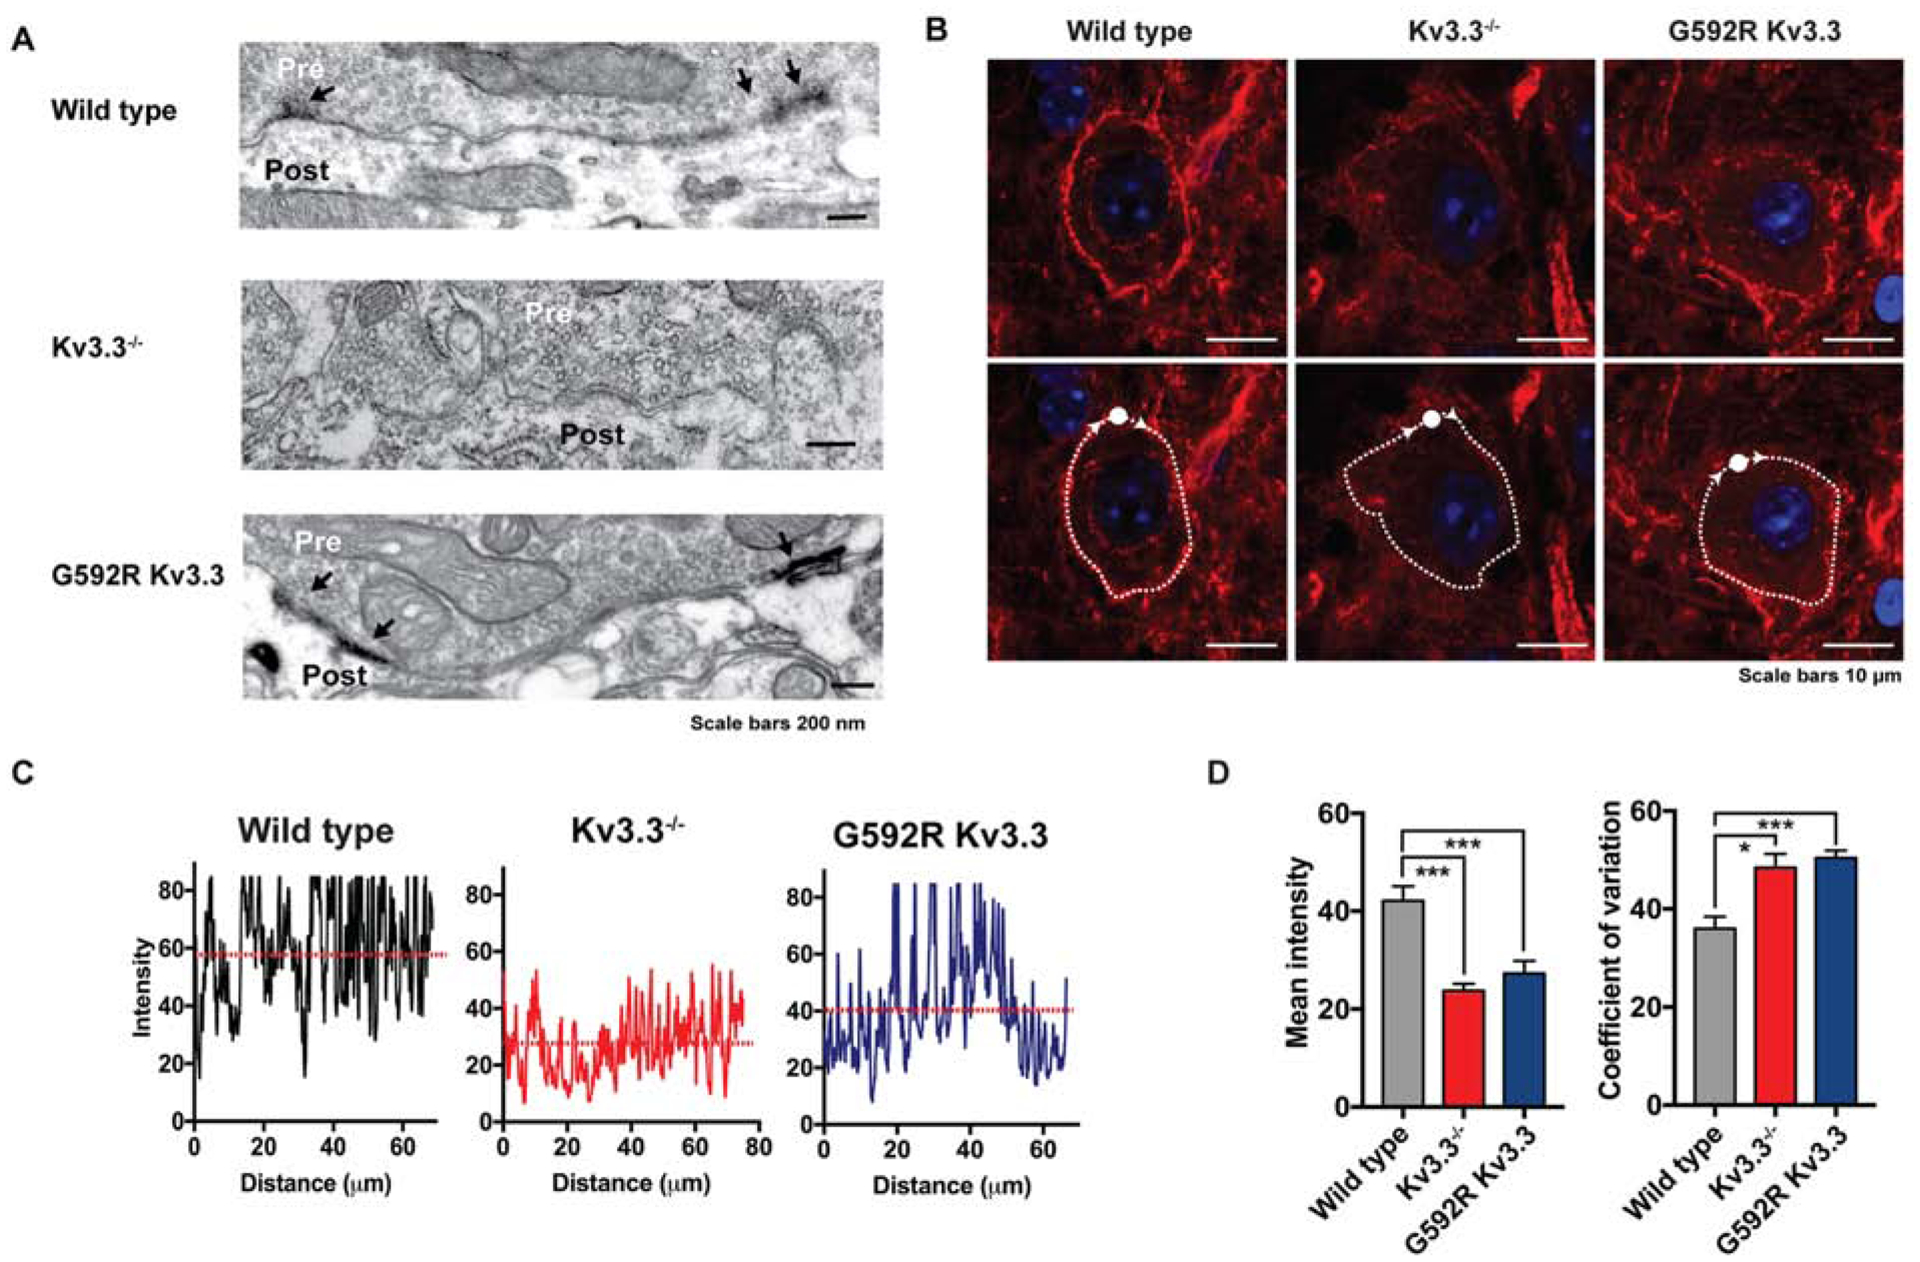
Figure 3.

Kv3.3 KO or Kv3.3G592R KI reduces F-actin at calyces
(A) Electron microscopic images showing Kv3.3 immunoreactivity (arrows) at the calyces of WT, Kv3.3−/− or Kv3.3G592R mouse. Results are representative of 8–36 immunostained sections from 1, 2 or 1 animal, respectively.
(B) Phalloidin labelling of F-actin at WT, Kv3.3−/−, and Kv3.3G592R calyces visualized using Airy-scan confocal microscopy. Upper panels: a dense ring of presynaptic F-actin staining surrounds MNTB neurons in WT; the intensity of actin staining is greatly reduced in Kv3.3−/− and Kv3.3G592R mice. Lower panels: the same sections with superimposed traces of lines following the circumference of the calyx. Such traces were used in panels C and D to quantify coefficient of variability for the intensity of pixels in the ring.
(C) Representative plots of pixel intensity across the circumference of WT, Kv3.3−/− and Kv3.3G592R cells.
(D) Bar graphs depicting mean pixel intensity and coefficient of variability (+ s.e.m.) for the three conditions. (*: p < 0.02; ***: p < 0.005, Brown-Forsythe and Welch ANOVA with Dunnett’s T3 multiple comparisons test).
