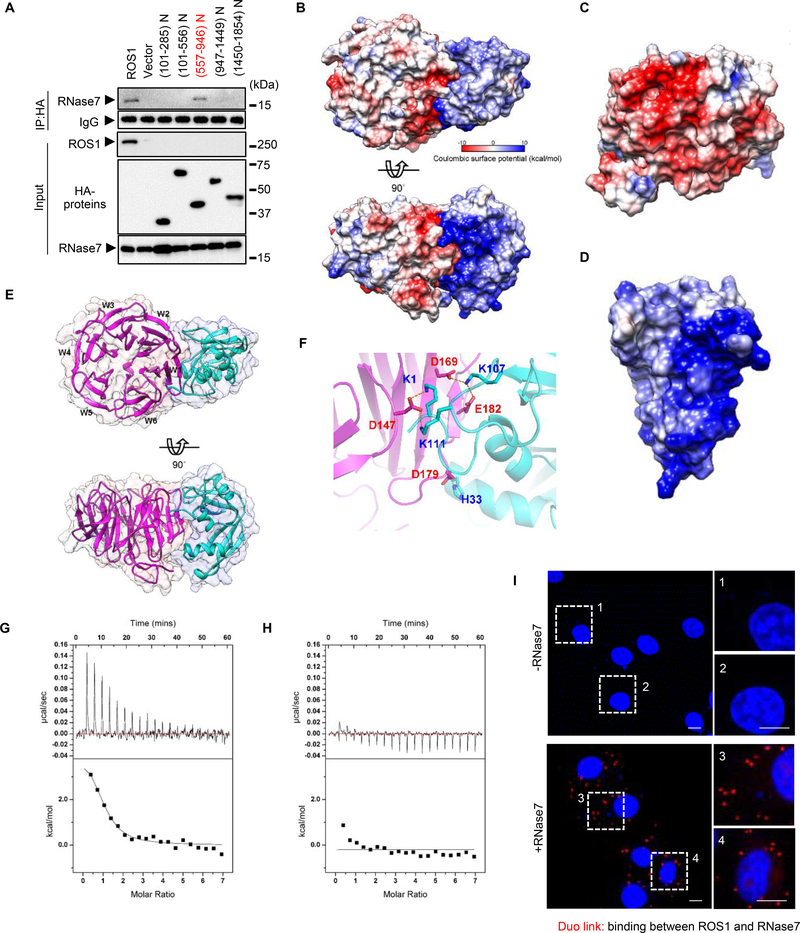
Fig. 2. RNase7 associates with ROS1 aa 557–946.
(A) HA-tagged ROS1 truncations depicted in the top scheme were co-transfected with Flag-tagged RNase7 in HEK-293T cells. (B) Top and side view of electrostatic potential surface of ROS1_P2 (homology model, left) and RNase7 (PDB: 2HKY, right). (C, D) Electrostatic potential surface of ROS1_P2 (C) and RNase7 (D). Blue for positive potential (10 kcal/mol), red for negative (−10 kcal/mol) and white for neutral. (E) Top and side view of ribbon diagram of ROS1_P2 (magenta) and RNase7 (cyan). (F) Expanded interface view of docked ROS1_P2-RNase7 complex. Residues are drawn in stick representation and labeled (blue for RNase7; red for ROS1_P2). Atoms of positively charged residues are shown in cyan and of negatively charged residues in magenta. Electrostatic bonds are connected by dotted lines in orange. (G) Significant heat absorption was observed when WT RNase7 was titrated into the cell containing ROS1_P2. (H) Changing the residues of RNase7 (K1A, K107A, and K111A) practically abolished ROS1_P2 binding to a level that is undetectable by ITC. (I), Ectopically ROS1-expressing HeLa cells were treated with or without RNase7 (1 μg/ml) for 15 min, and subjected to a Duolink assay. Scale bar, 10 μm. Right, two different positions were randomly selected at each point.

