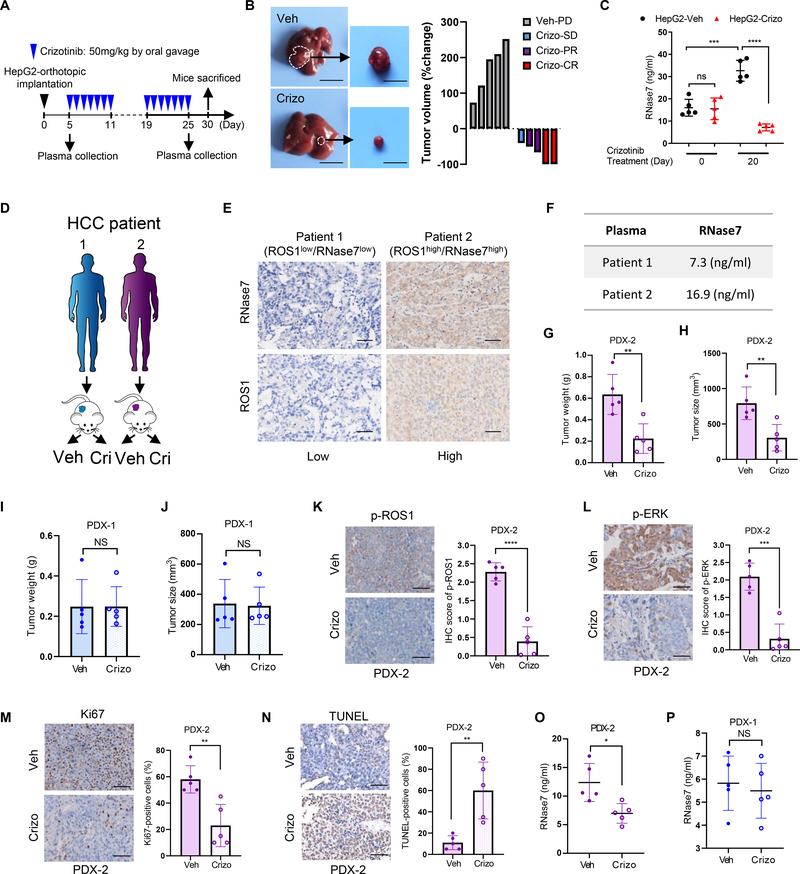
Fig. 6. RNase7 acts as a plasma biomarker for anti-ROS1 therapy in pre-clinical models.
(A) Schematic of the treatment protocol for crizotinib in the HepG2-orthotopic model. (B) HepG2 orthotopic tumor sensitive to crizotinib treatment. Left: representative images of orthotopic liver tumors with three weeks vehicle or crizotinib treatment. Right: waterfall plot of response to vehicle (n = 5) or crizotinib treatment (n = 5). CR: complete response; PR: partial response; SD: stable disease; PD: progressive disease. (C) ELISA analysis of RNase7 expression levels in plasma samples from the indicated groups of mice at Day 0 and Day 20 after crizotinib treatment. (D) Schematic treatment administration in PDX models. (E) Representative images of ROS1 and RNase7 IHC staining of HCC tissue samples from patients in (D). Scale bar, 50 μm. (F), RNase7 expression levels across HCC PDX models. (G-J) Tumor weight and volume was assessed in PDX-2 (G and H) or in PDX-1 (I and J) after 4-week treatment (vehicle, n = 5; crizotinib, n = 5). (K-N) Decreased p-ROS1 (K) and p-ERK level (L), decreased proliferative index (M) and increased apoptosis (N) were observed in PDX-2 tumors after crizotinib treatment. Left, representative images of indicated staining. Right, quantification result according to IHC score. Scale bar, 50 μm. (O, P) ELISA analysis of RNase7 expression levels in plasma samples from PDX-2 (O) and PDX-1 (P) after 4 weeks crizotinib treatment.
Error bars represent mean ± SD. *P < 0.05, **P < 0.01, and ***P < 0.001, Student’s t-test unless otherwise noted. NS, not significant.

