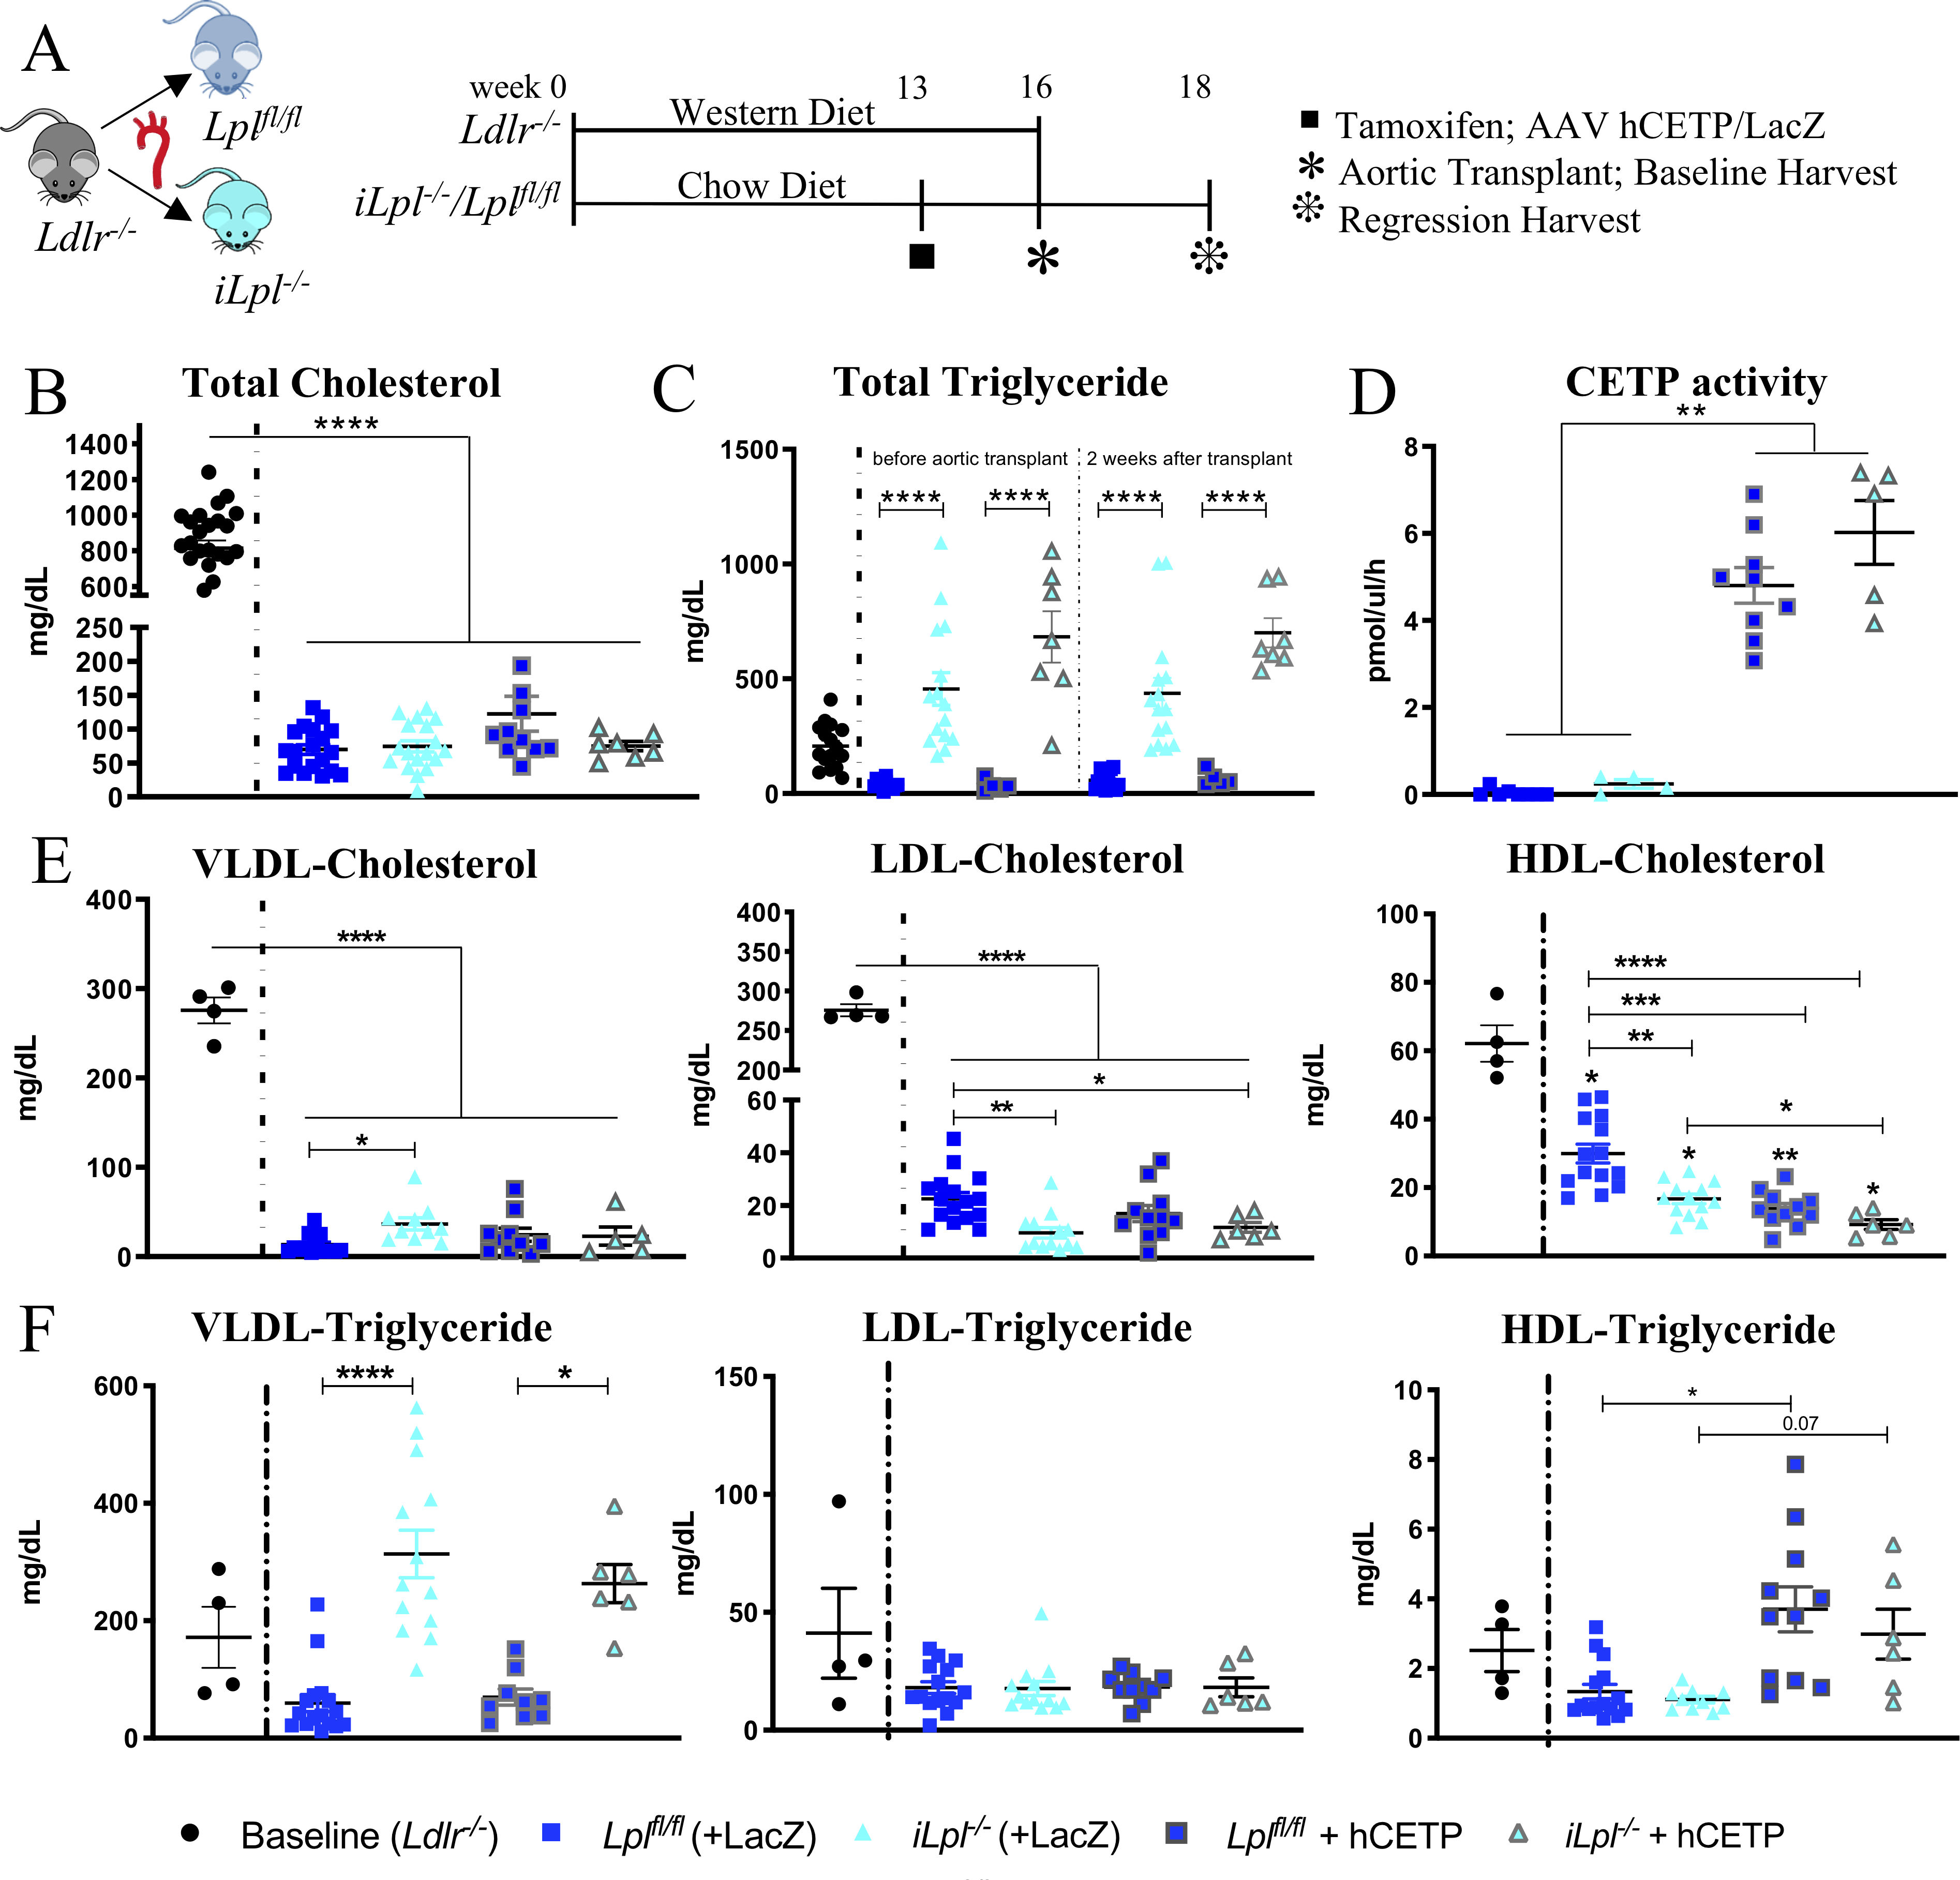
Figure 1. LpL deficiency increased VLDL-TG and reduced HDL-C, which was further reduced with hCETP expression.

(A) Study Setup (B) Total plasma cholesterol levels at time of harvest (C) Total triglyceride (TG) levels in baseline and regression groups before and after the 2 weeks atherosclerosis regression period (D) CETP activity measured in circulation. Cholesterol (E) and triglyceride levels (F) of isolated lipoproteins. N= (B, C) Baseline 26, Lplfl/fl 19, Lpl−/− 18, Lplfl/fl +hCETP 11, Lpl−/− + hCETP 7; (D) Lplfl/fl 8, Lpl−/− 4, Lplfl/fl +hCETP 9, Lpl−/− + hCETP 5; (E, F) Baseline 4, Lplfl/fl 15, Lpl−/− 13, Lplfl/fl +hCETP 10, Lpl−/− + hCETP 6. Data represented as mean ± SEM, * P < 0.05, ** P<0.01, *** P < 0.001, **** P < 0.0001, 1-way ANOVA with Tukey’s multiple comparison test; HDL-C and HDL-TG Welch ANOVA with Games-Howell’s multiple comparison test; VLDL-TG & LDL-TG Kruskal-Wallis Test with Dunn’s multiple comparison test.
